

2021
-
GBPUSD Why it is still a sell for the year 2022
- December 29, 2021
- Posted by: Tradingshot Articles
- Category: Forex
No Comments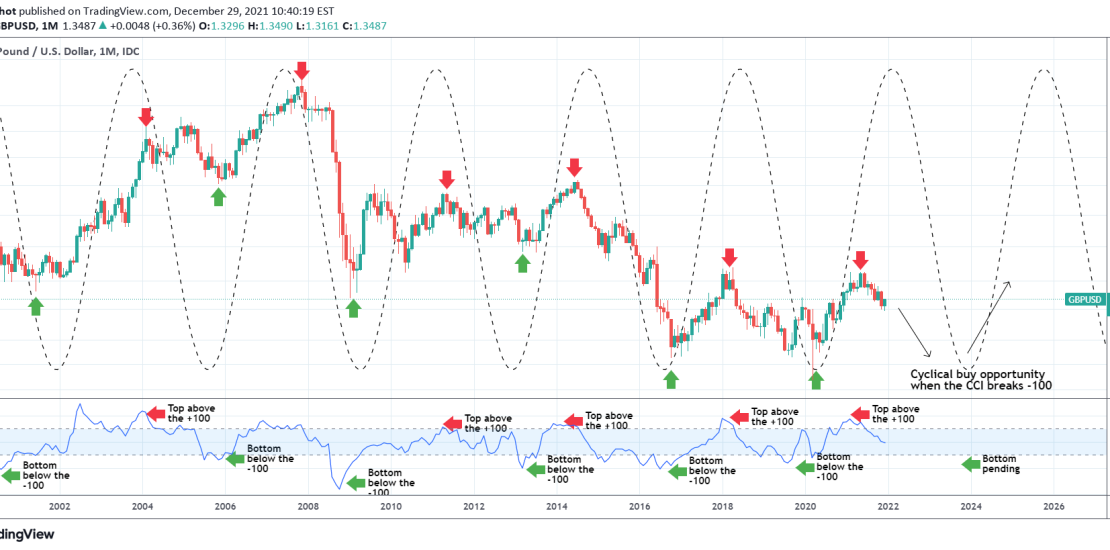
This is a (very) long-term chart of GBPUSD on a multi-decade long basis on the 1M time-frame, as I want to make a clear case why, despite of December’s rise, the pair will remain a ‘sell’ during the majority at least of 2022. I’ve plotted the Sine Waves to illustrate the sense of long-term
-
WTI OIL The important 1D MA50 test
- December 27, 2021
- Posted by: Tradingshot Articles
- Category: Commodities
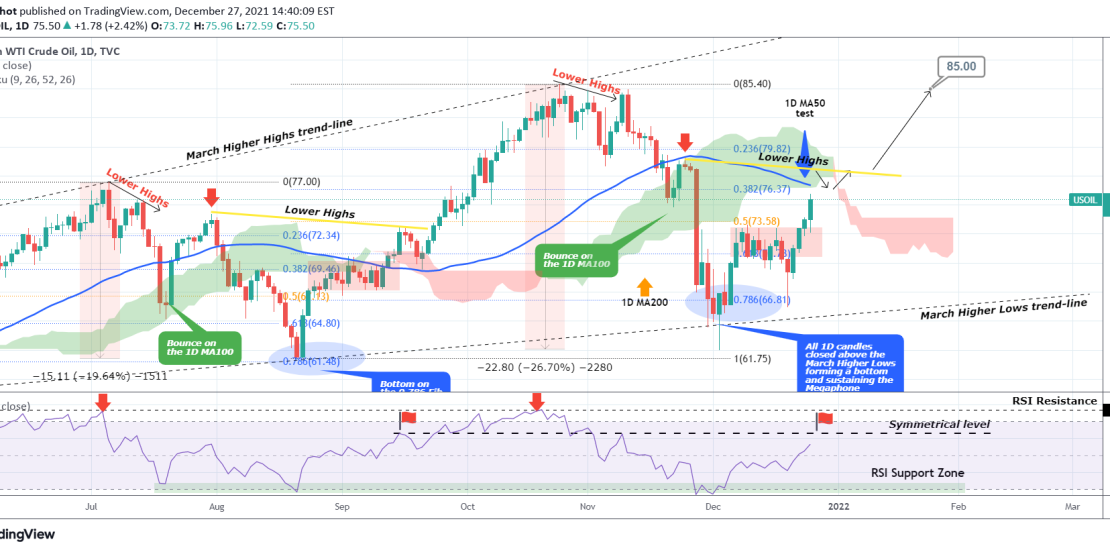
Right now WTI is ahead of the first important test of this uptrend, the 1D MA50 (blue trend-line) which is currently posing as a Resistance. If that breaks, we have a strong case of a bullish continuation. However, this the current wave is repeating that of August – September quite closely, the (yellow) Lower
-
DOW JONES hit the 1D MA200. Buy fractal spotted.
- December 20, 2021
- Posted by: Tradingshot Articles
- Category: Stock Indices
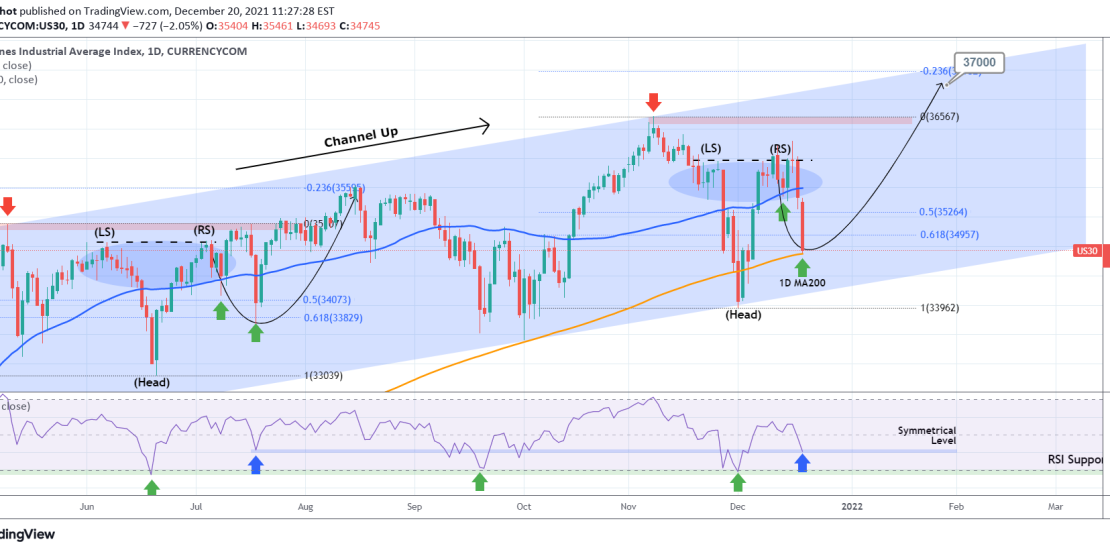
Dow Jones has had a very sharp two-day pull-back, which hit today the 1D MA200 (orange-trend-line). That came off an Inverse Head and Shoulders pattern (IH&S) that continues to resemble that of June – July. With the 1D RSI hitting the Symmetrical Support level of the July 19 low which initiated the strong rebound
-
DXY Possible Double Top formation and rejection lower
- December 16, 2021
- Posted by: Tradingshot Articles
- Category: Forex
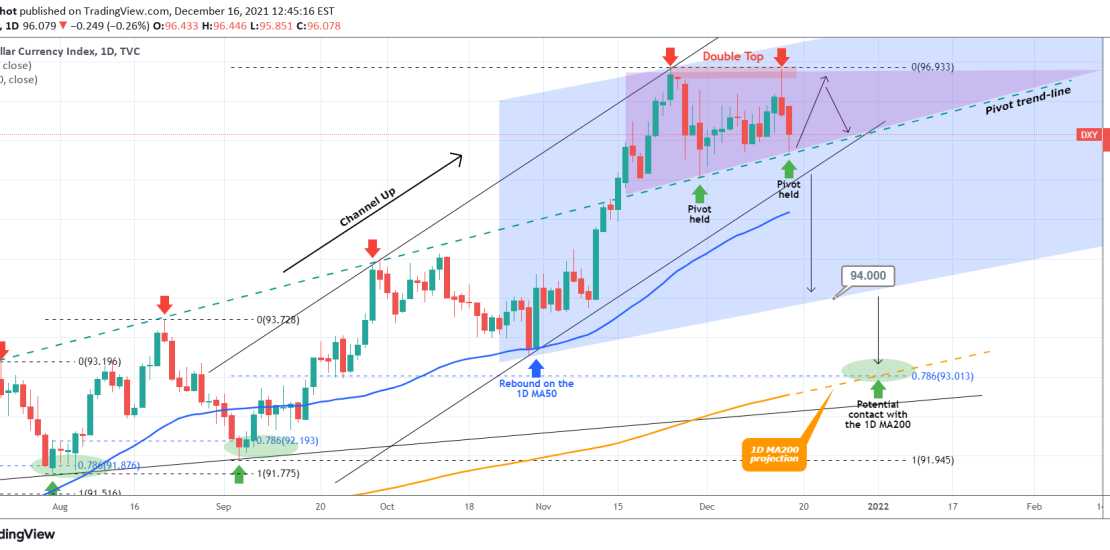
The U.S. Dollar Index got rejected yesterday on the 96.900 Resistance, having made what is so far a Double Top. Technically a rejection follows after such a pattern but this time the pattern is spoiled by the pivot trend-line which provided today support and a bounce, as it did on November 30. As long
-
WTI OIL Consolidation almost over. Buy the break-out.
- December 16, 2021
- Posted by: Tradingshot Articles
- Category: Commodities
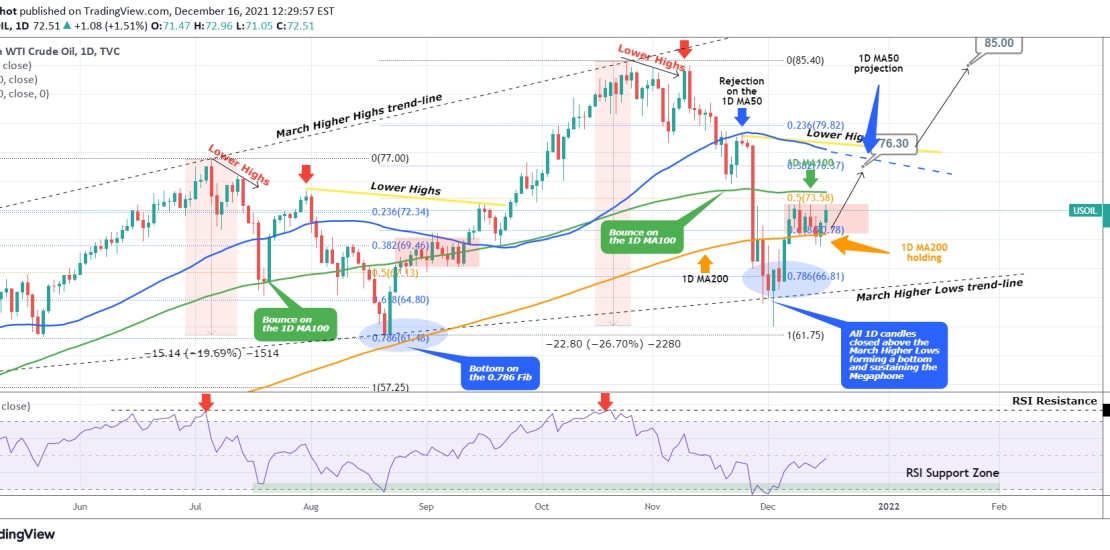
This is an update to a pattern on WTI that I’ve been working on since August: As you see, the price did eventually rebound and right now is consolidating within the 1D MA200 (orange trend-line) being the Support and the 1D MA100 (green trend-line) being the Resistance. This is similar to the August 25
-
DOW JONES and the fractal of DOOM it should avoid
- December 15, 2021
- Posted by: Tradingshot Articles
- Category: Stock Indices
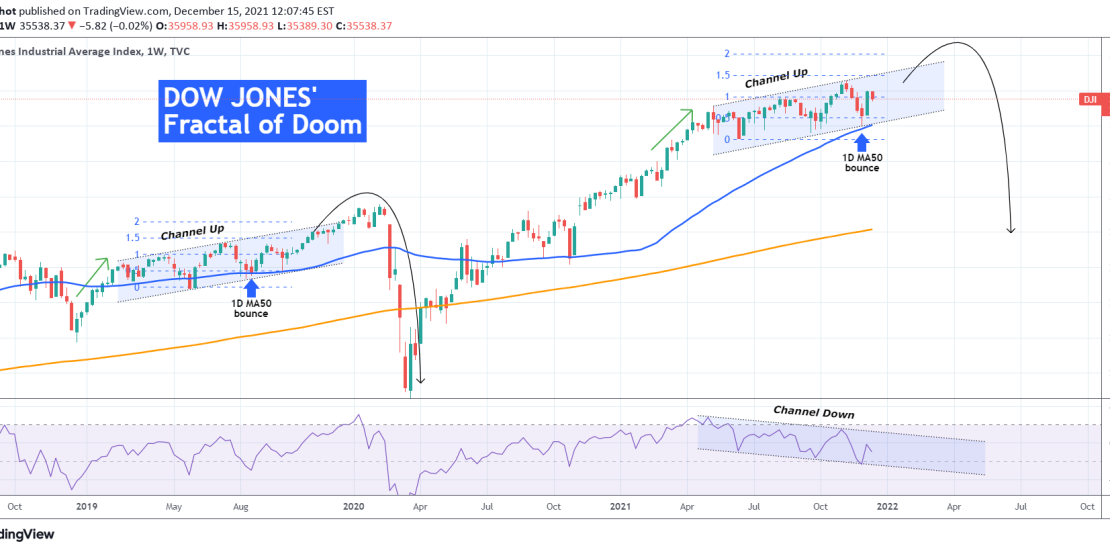
Dow Jones has been trading inside a Channel Up since the Q2 of 2021 a time during which I have been bullish buying every Higher Low within the pattern. This hasn’t changed, especially after it recently made a strong rebound exactly on the 1W MA50 (blue trend-line), which during long-term uptrends is typically the major
-
WTI OIL approaching a medium-term Resistance
- December 8, 2021
- Posted by: Tradingshot Articles
- Category: Commodities
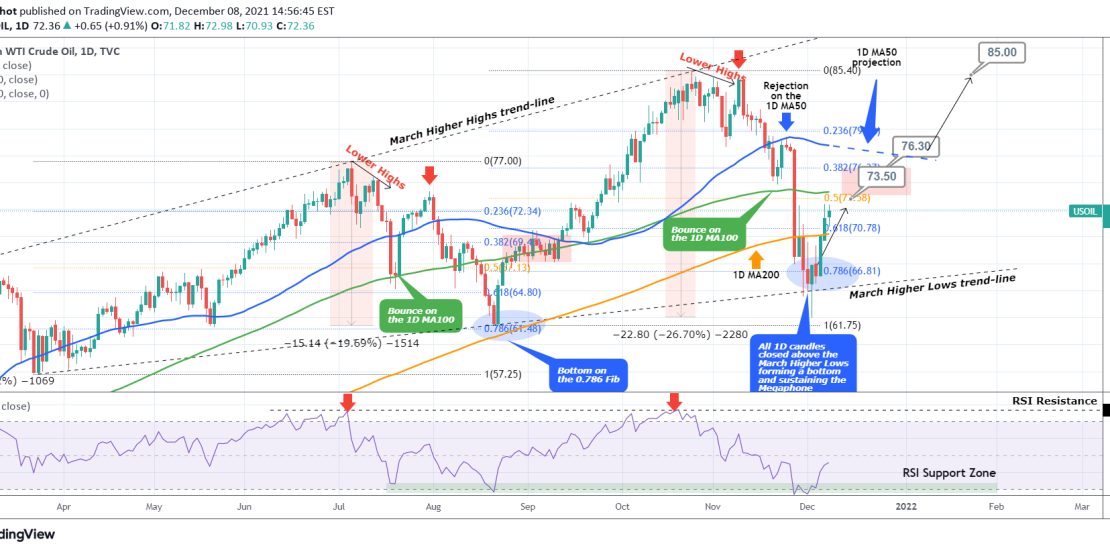
This is an update to my WTI Oil outlook made over a week ago: Despite breaking below the 0.786 Fibonacci retracement level and the Higher Lows trend-line of the multi-month Bullish Megaphone pattern, the price managed to close all 1D candles within the pattern and formed a Support. It has come very close to
-
DOW JONES Buy opportunity on the 1D MA200 and 0.618 Fib
- December 1, 2021
- Posted by: Tradingshot Articles
- Category: Stock Indices
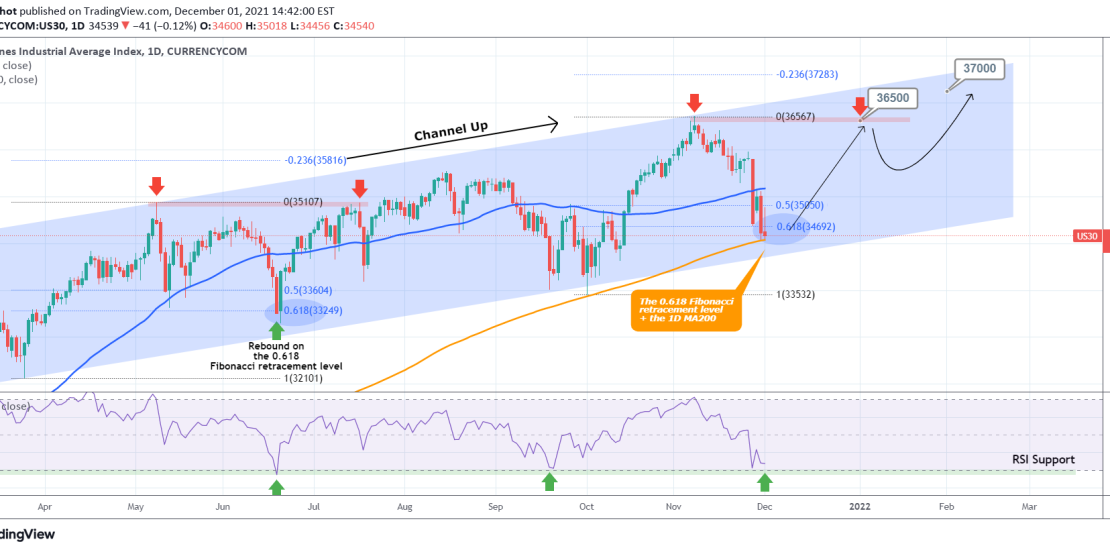
Pattern: Channel Up on 1D. Signal: Buy as the price reached both the 0.618 Fibonacci retracement level as well as the 1D MA200 (orange trend-line). The last parameter to fulfil is the RSI Support, so allow margin for one last low at the bottom of the Channel Up. Target: 36500 (Resistance and All Time
-
S&P500 is approaching its medium-term buy level
- November 30, 2021
- Posted by: Tradingshot Articles
- Category: Stock Indices
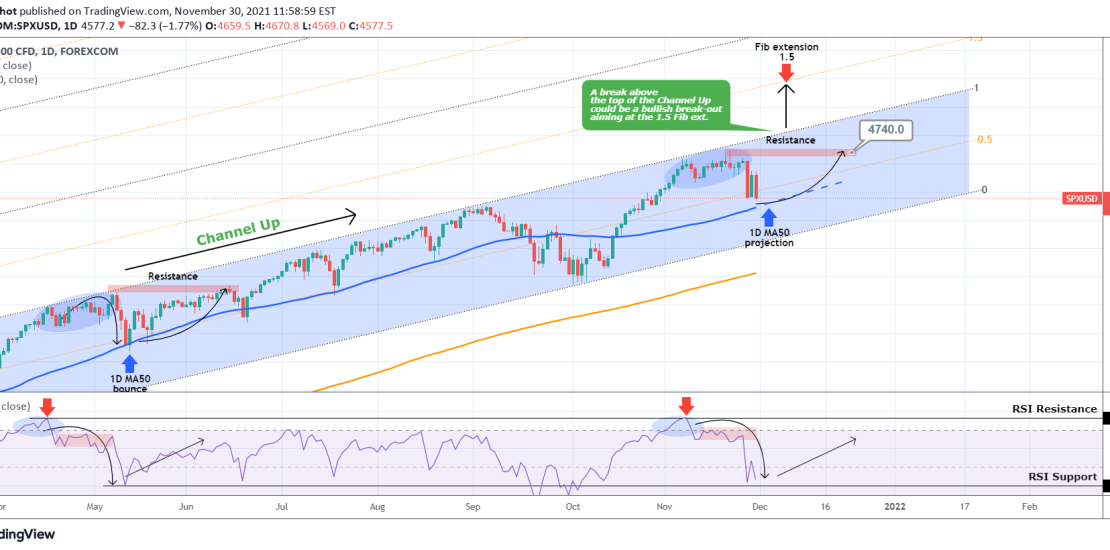
It is time to update our perspective on the S&P500, which we last analyzed a week ago when we called the exact market top on November 22: As you see the index got rejected that day and corrected instantly, which based on our analysis is a much needed technical correction in accordance with the
-
WTI OIL Ideal long-term buy opportunity
- November 30, 2021
- Posted by: Tradingshot Articles
- Category: Commodities
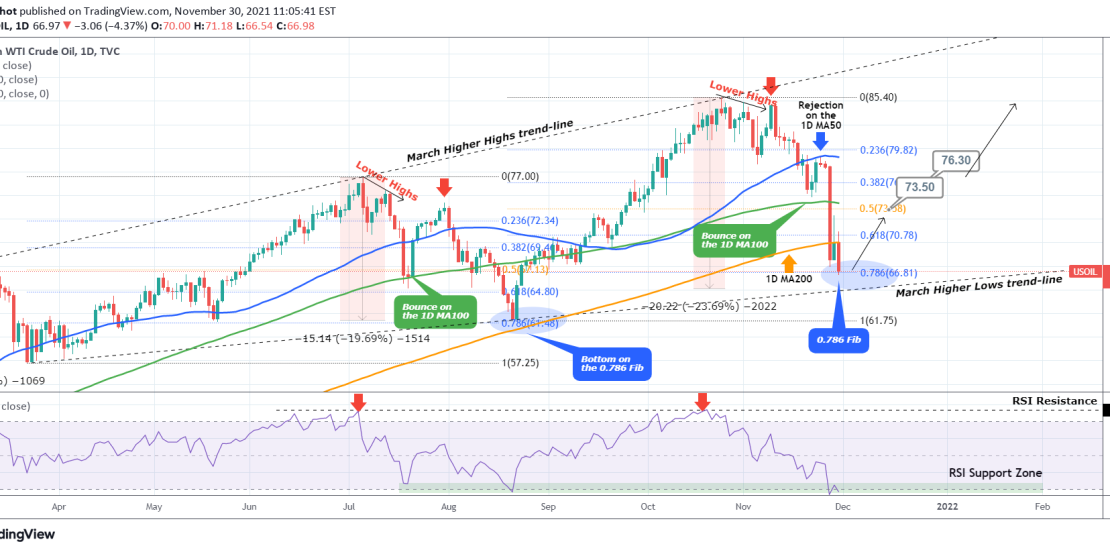
WTI Oil is down more than -20% since the October High. The fundamentals over the new Omicron COVID variant have undoubtedly accelerated this but technically this is a much needed correction following the big rally of August – October. My last update on WTI was the following, where I pointed out the upcoming rejection