

- December 29, 2021
- Posted by: Tradingshot Articles
- Category: Forex
This is a (very) long-term chart of GBPUSD on a multi-decade long basis on the 1M time-frame, as I want to make a clear case why, despite of December’s rise, the pair will remain a ‘sell’ during the majority at least of 2022.
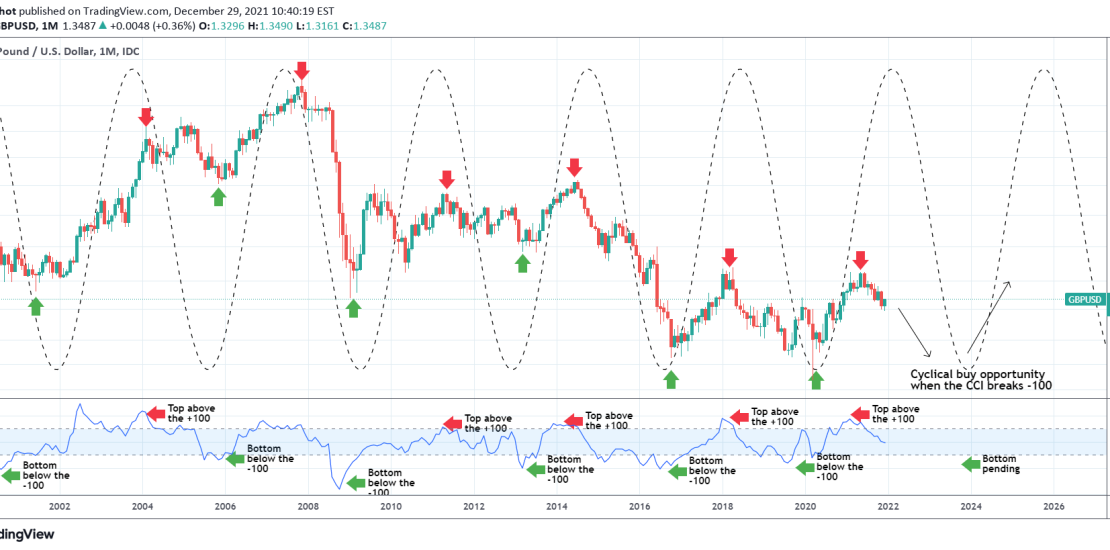
I’ve plotted the Sine Waves to illustrate the sense of long-term Cycles on this pair. As you see, for the past 20 years at least (since 2000), the Sine Waves manage to fairly accurate display the multi-year cyclical effect. Bottoms (green arrows) and tops (red arrows) happen to be very close to where the Cycles suggest.
An indicator that greatly compliments this approach is the CCI. As shown, when the price is close to the Sine Wave low and the 1M CCI is below -100.00, then GBPUSD is at or very close to its Cyclical Bottom (green arrows). Similarly, when the price is close to the Sine Wave high and the 1M CCI is above +100.00, then the pair is at or close to its Cyclical Top (red arrows).
Right now, the CCI is exactly on the CCI middle (0.00) having previous been above +100.00, thus pricing the Cyclical Top (Feb – May 2021). Based on this strategy, the Bottom isn’t yet in for this phase of the Cycle, thus my bearish outlook for 2022. The next Cyclical (long-term) buy opportunity should emerge in 2023 once the CCI breaks again below -100.00.
Tradingview link:
https://www.tradingview.com/chart/GBPUSD/ri9wNL1n-GBPUSD-Why-it-is-still-a-sell-for-the-year-2022