- December 8, 2021
- Posted by: Tradingshot Articles
- Category: Commodities

This is an update to my WTI Oil outlook made over a week ago:
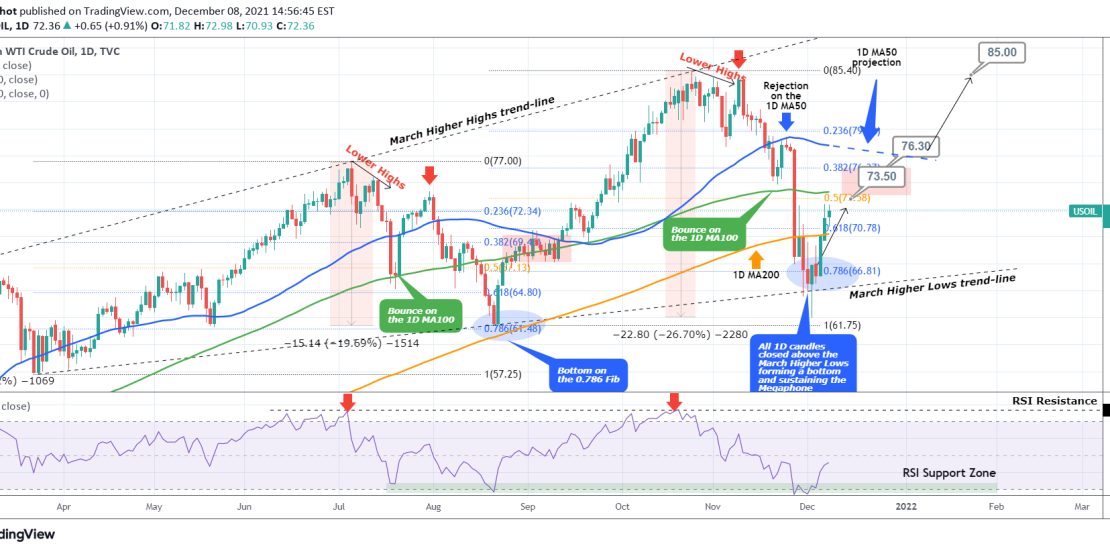
Despite breaking below the 0.786 Fibonacci retracement level and the Higher Lows trend-line of the multi-month Bullish Megaphone pattern, the price managed to close all 1D candles within the pattern and formed a Support. It has come very close to my first 73.50 Target which is near the 0.5 Fibonacci level and the 1D MA100 (green trend-line). I consider this a strong Resistance, in fact the whole zone as high as the 1D MA50 (blue trend-line), where we can see a weekly consolidation and sideways trading in a similar way as in late August – early September.
Short-term traders may buy if the price breaks above the 1D MA100 and target 76.30 and engage for a more long-term trade only if the 1D MA50 breaks (TP 85.00 in that case).
Tradingview link:
https://www.tradingview.com/chart/USOIL/TTMBqJ1b-WTI-OIL-approaching-a-medium-term-Resistance


