

2021
-
WTI OIL Bearish Reversal pattern
- November 3, 2021
- Posted by: Tradingshot Articles
- Category: Commodities
No Comments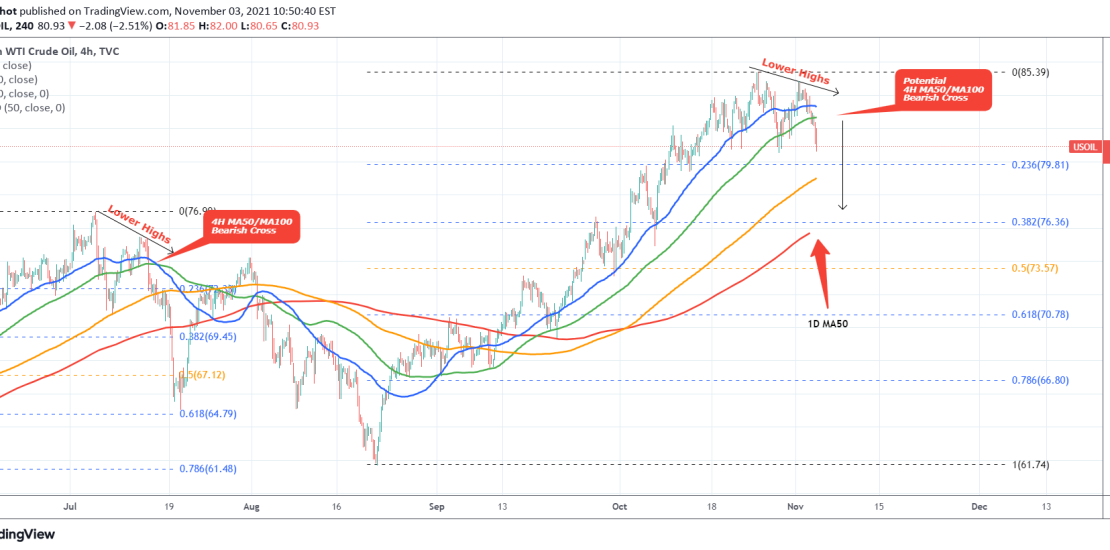
WTI Oil is on a typical Bearish Reversal pattern and the first signs of this were given last week as posted on my most recent analysis: Right now the price is on Lower Highs, similar to the July peak and reversal fractal. If a 4H MA50 (blue trend-line) / MA100 (green trend-line) Bearish Cross
-
AUDNZD Long-term Buy Signal
- November 1, 2021
- Posted by: Tradingshot Articles
- Category: Forex
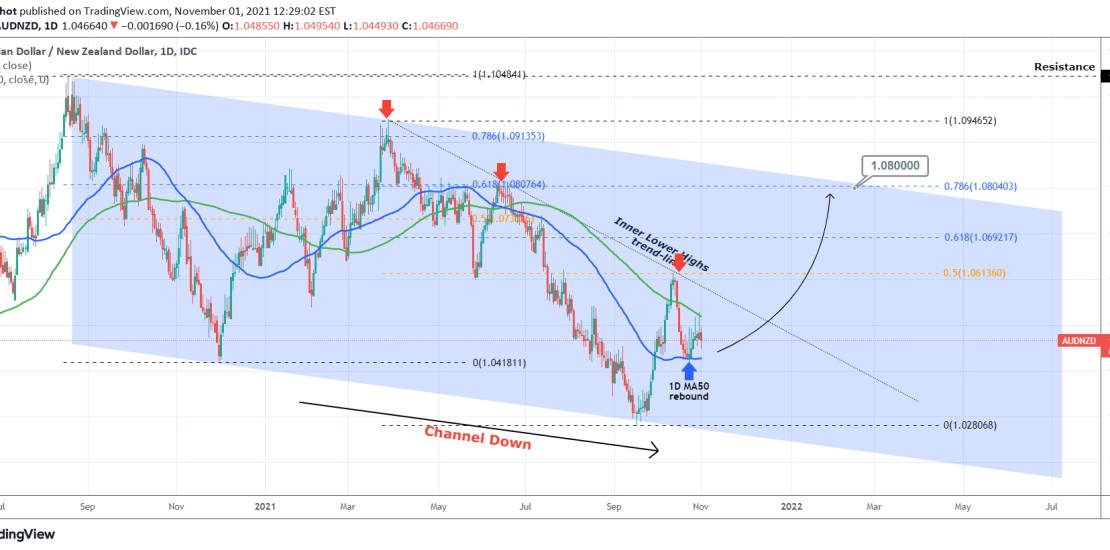
Pattern: Channel Down on 1D. Signal: Buy as the price rebounded on the 1D MA50 (blue trend-line) and is on the bullish leg towards the top (Lower Highs trend-line) of the Channel Down. Target: 1.0800 (the 0.786 Fibonacci extension) as per the previous Lower High leg. Tradingview link: https://www.tradingview.com/chart/AUDNZD/FZz0ojQj-AUDNZD-Long-term-Buy-Signal
-
USDCAD 2022 will be a very bullish year for the pair
- November 1, 2021
- Posted by: Tradingshot Articles
- Category: Forex
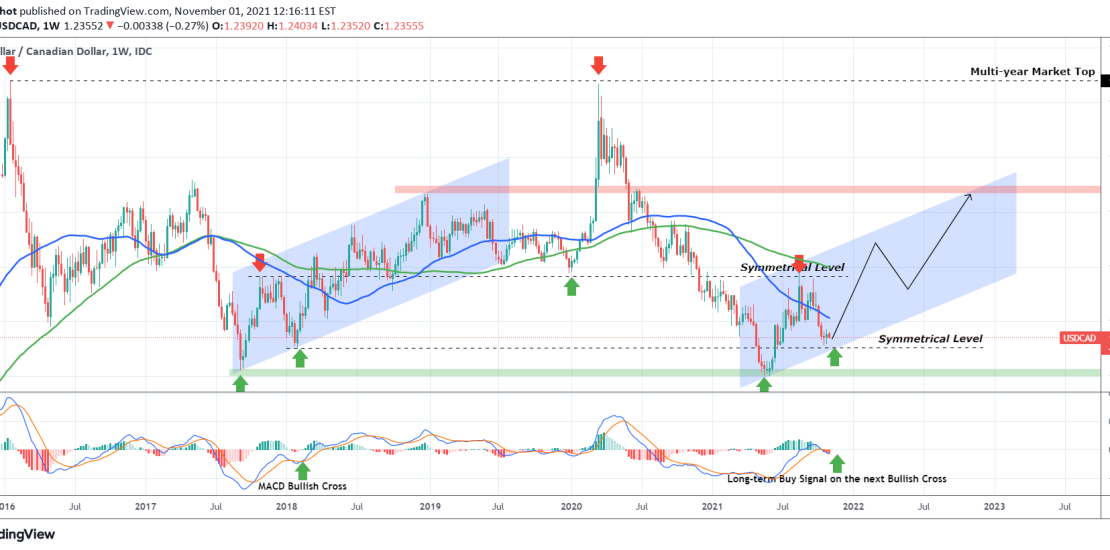
As the title suggests, I expect USDCAD to be bullish for 2022. The reason is the fractal (on this 1W time-frame) from 2017 – 2018 that the pair appears to be replicating. As you see this market follows strict Support and Resistance levels, easily recognizable on the long-term scale. The Multi-year Market Top of
-
S&P500 One last 1D MA50 touch left before $4800?
- October 29, 2021
- Posted by: Tradingshot Articles
- Category: Stock Indices
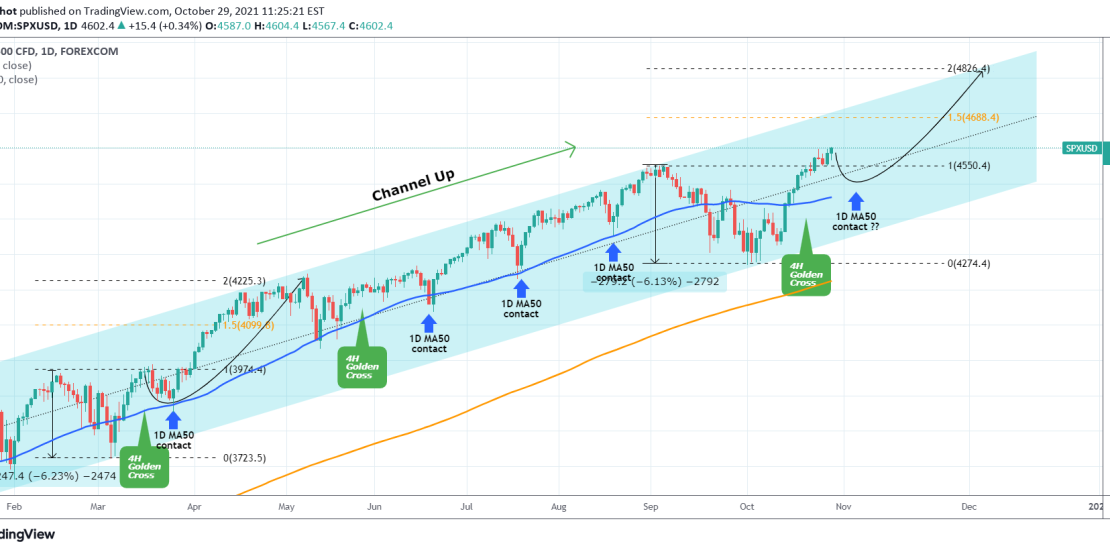
S&P has made new All Time Highs (ATH) since my analysis at the start of the month, where the diverging 1D RSI gave a strong buy signal at the bottom of the multi-month Channel Up: As you see the signal worked out well and the index has now the 1.5 Fibonacci extension as its
-
WTI OIL Reversal confirmed if daily closes below the 4H MA100
- October 28, 2021
- Posted by: Tradingshot Articles
- Category: Commodities
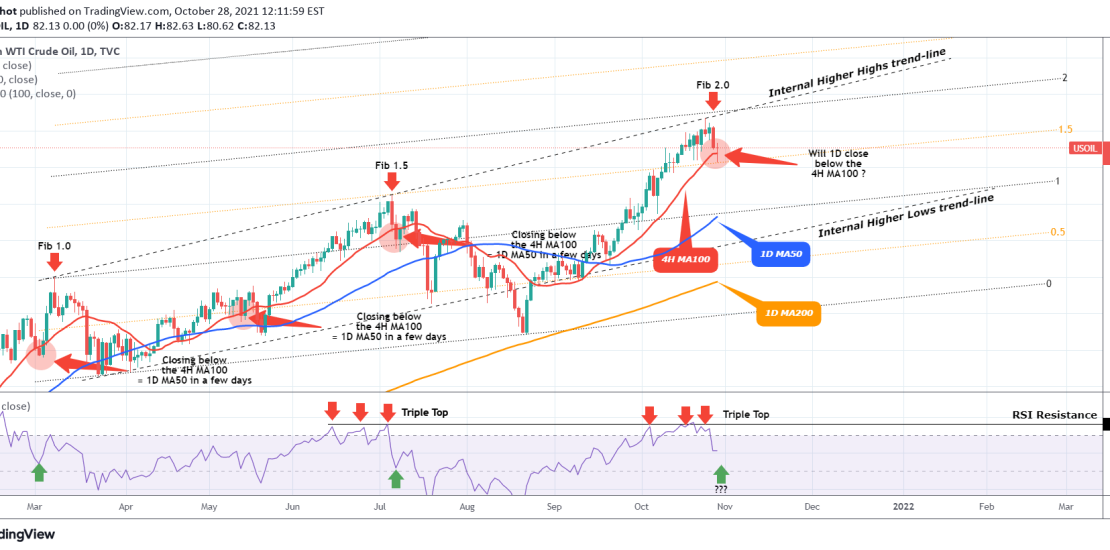
Even though my firms thesis has been very bullish on WTI Oil long-term throughout the whole year, that doesn’t stop me from spotting potential medium-term tops and technical corrections that only serve for sustaining the uptrend on the long-term. An example was my following idea on October 19: So far it appears that the
-
NASDAQ 4H Golden Cross aims at 16300 long-term
- October 25, 2021
- Posted by: Tradingshot Articles
- Category: Stock Indices
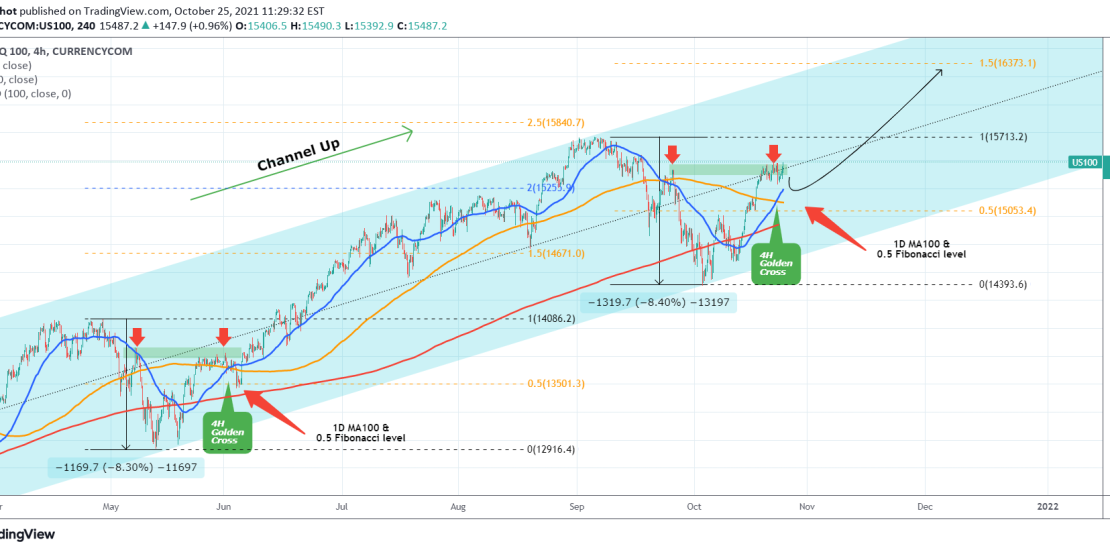
My most recent Nasdaq post was a buy signal on the 1D MA50: Currently we have a buy continuation signal for the long-term towards the 1.5 Fibonacci extension (16300) with a potential short-term pull-back to add more longs on the 0.5 Fib retracement or the 1D MA100 (red trend-line). This is based on the May
-
DAX Bullish continuation towards 16000.
- October 25, 2021
- Posted by: Tradingshot Articles
- Category: Stock Indices
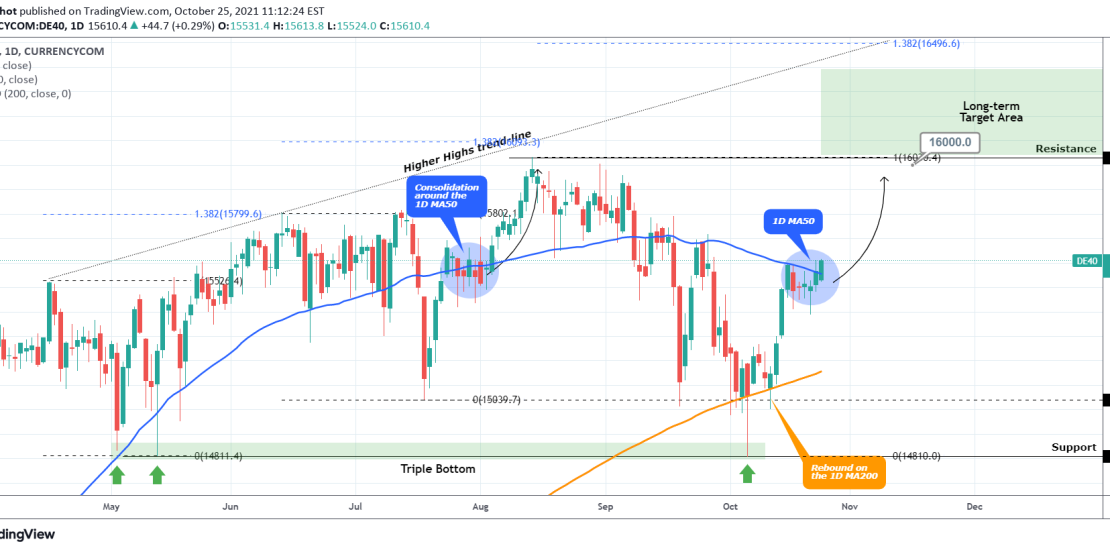
My last DAX analysis was on a bus signal after the price broke above the 4H MA50: The short-term target of the 4H MA200 eventually got reached and now I shift my focus for the medium-term back to the 1D time-frame. As you see the price has been trading around the 1D MA50 (blue
-
US10Y Signs of a bearish reversal.
- October 25, 2021
- Posted by: Tradingshot Articles
- Category: Other
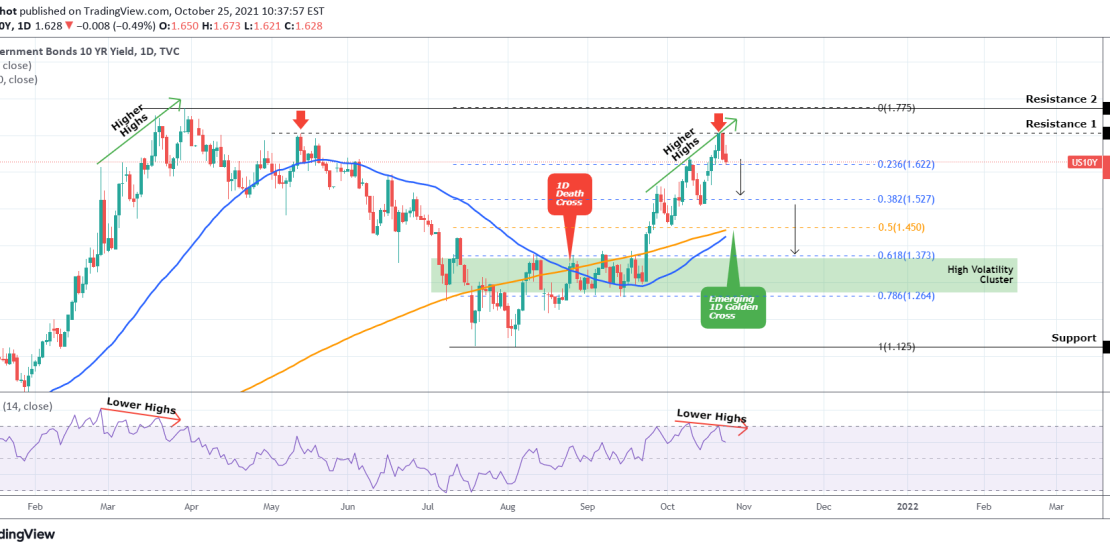
The US10Y has reached (and so far got rejected on) the 1.707 Resistance (1), which last time rejected the price on May 13. With the 1D RSI on a Bearish Divergence (is on Lower Highs while the actual price is on Higher Highs), similarities can be made with the February 25 – March 30
-
XAUUSD Close to a Golden Cross. Next Targets: 1810, 1820
- October 19, 2021
- Posted by: Tradingshot Articles
- Category: Commodities
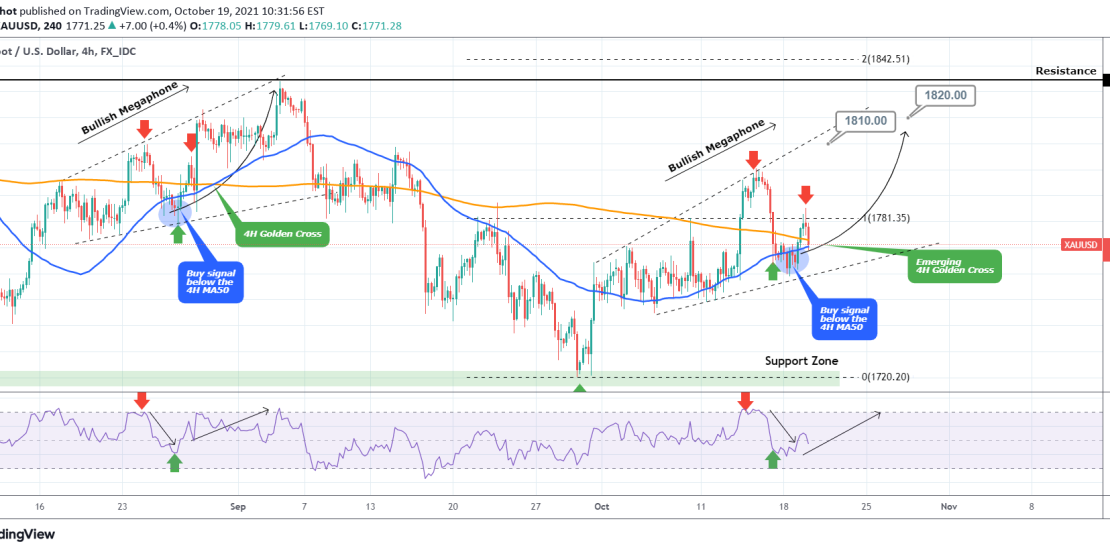
Pattern: Bullish Megaphone on 4H. Signal: Buy as the price rebounded after breaking just below the 4H MA50 (blue trend-line), in similar way as the August – September Bullish Megaphone. We are now on the second red arrow leg. Target: 1810 and 1820 in extension (symmetrical levels from Aug-Sep). Tradingview link: https://www.tradingview.com/chart/XAUUSD/H8W2ZvG9-XAUUSD-Close-to-a-Golden-Cross-Next-Targets-1810-1820
-
WTI OIL is about to top soon. Reversal imminent.
- October 19, 2021
- Posted by: Tradingshot Articles
- Category: Commodities
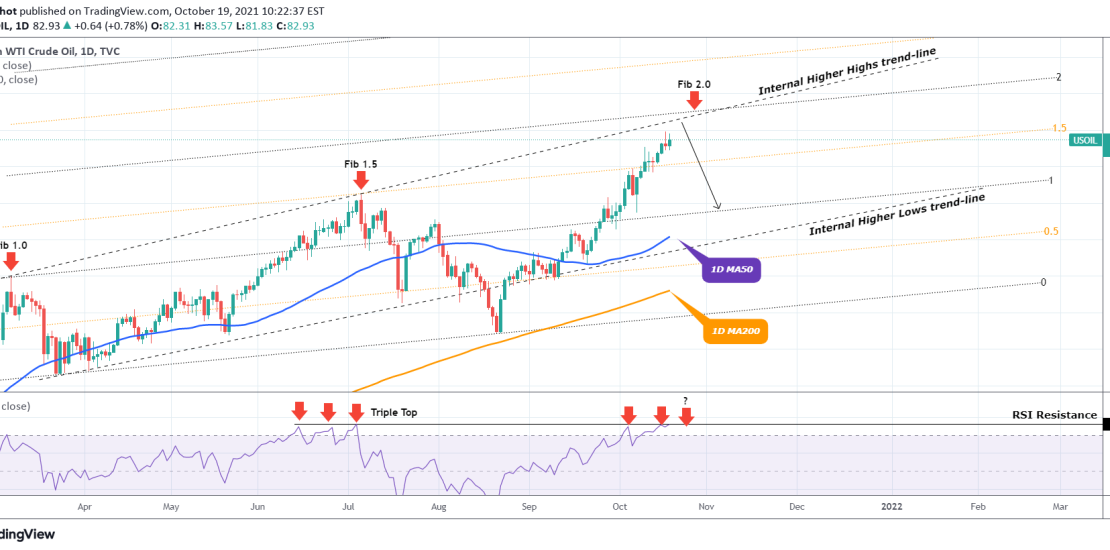
On my most recent WTI Oil idea I laid out the reason why I expected it to tun parabolic towards $82.50: That target has now been reached and on the 1D time-frame, WTI is approaching a very strong Support cluster both on price and RSI terms. As you see the price is close to