2020 October
-
BITCOIN Why a break above $13865 can deliver a “Santa Rally”
- October 30, 2020
- Posted by: Tradingshot Articles
- Category: Cryptocurrency
No Comments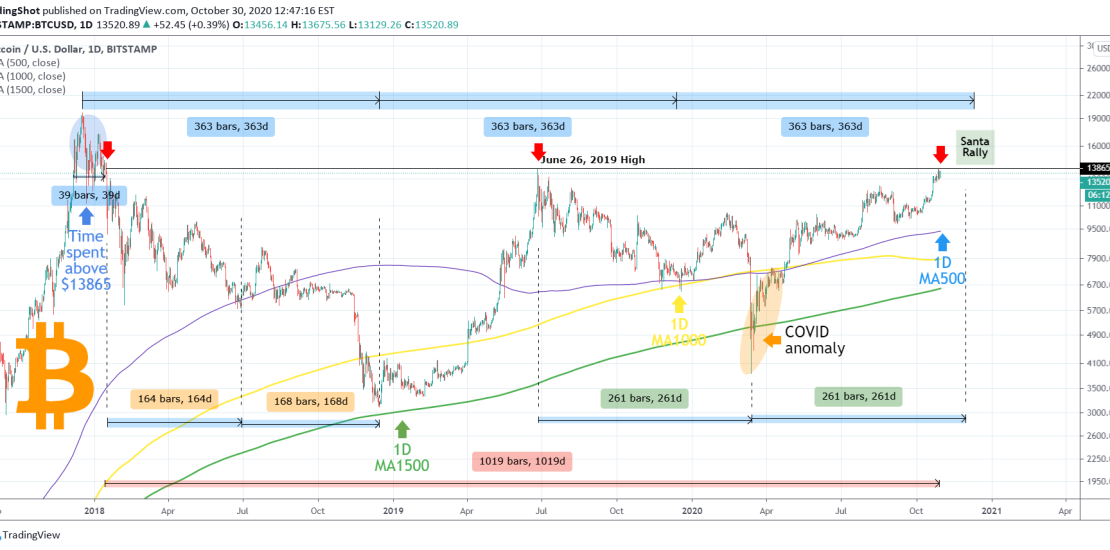
This study revolves around the importance of the $13865 level. This is of course what is known to most as the June 26, 2019 High and current Resistance for Bitcoin’s uptrend. I show on this idea why this level is more than just a Resistance. ** Only 39 days above 13865 ever! ** First
-
WTI OIL Buy Signal
- October 30, 2020
- Posted by: Tradingshot Articles
- Category: Commodities
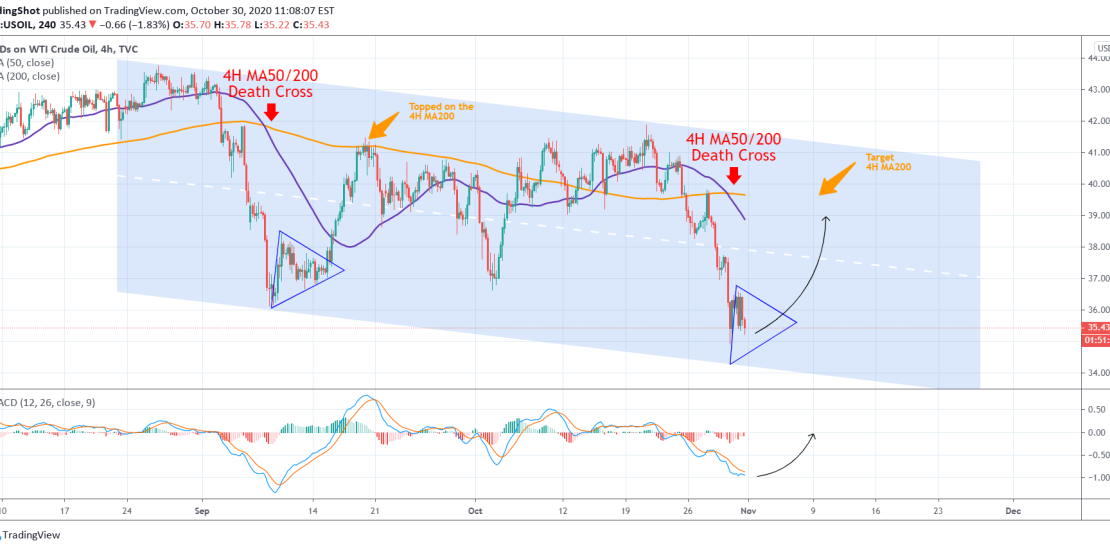
Pattern: Channel Down on 4H. Signal: Buy as the current bearish leg is forming a sequence similar to the September 01 – 14 leg = Death Cross, followed by a Triangle bottom. The signal is invalidated if the Channel breaks the Lower Low trend-line. Target: The 4H MA200. Please like, subscribe and share your
-
GOLD to BITCOIN ratio. Are gold investors switching back to BTC
- October 30, 2020
- Posted by: Tradingshot Articles
- Category: Cryptocurrency
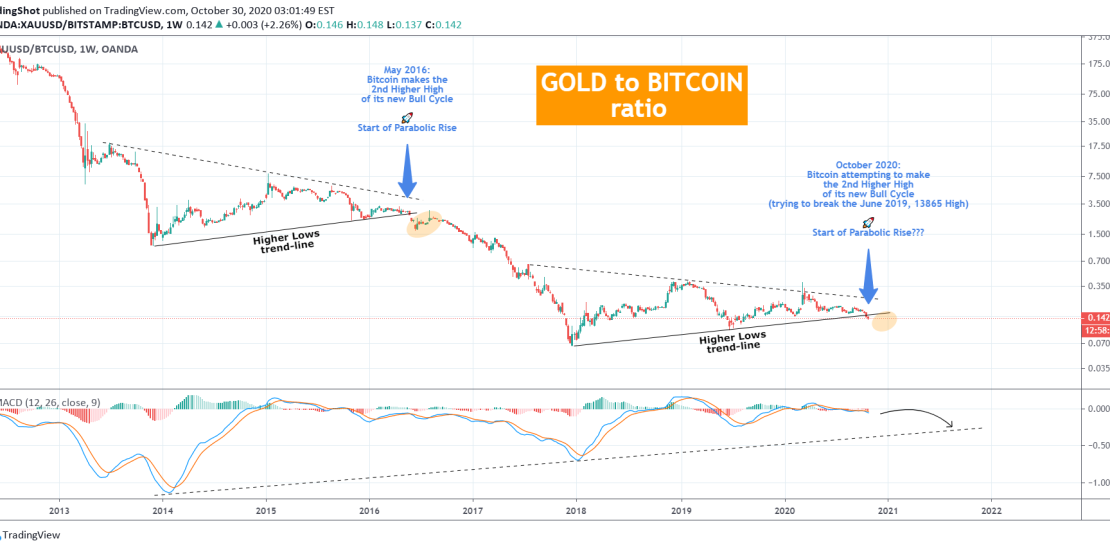
I have used the Gold-to-BTC ratio many times in my publications, one of the most informative of those seen below: I looked into it again as lately I am seeing an interesting price action between the two. While Gold struggles to regain its bullish momentum of the early part of the year, Bitcoin touched
-
TEZOS (XTZUSD) Buy Signal
- October 29, 2020
- Posted by: Tradingshot Articles
- Category: Cryptocurrency
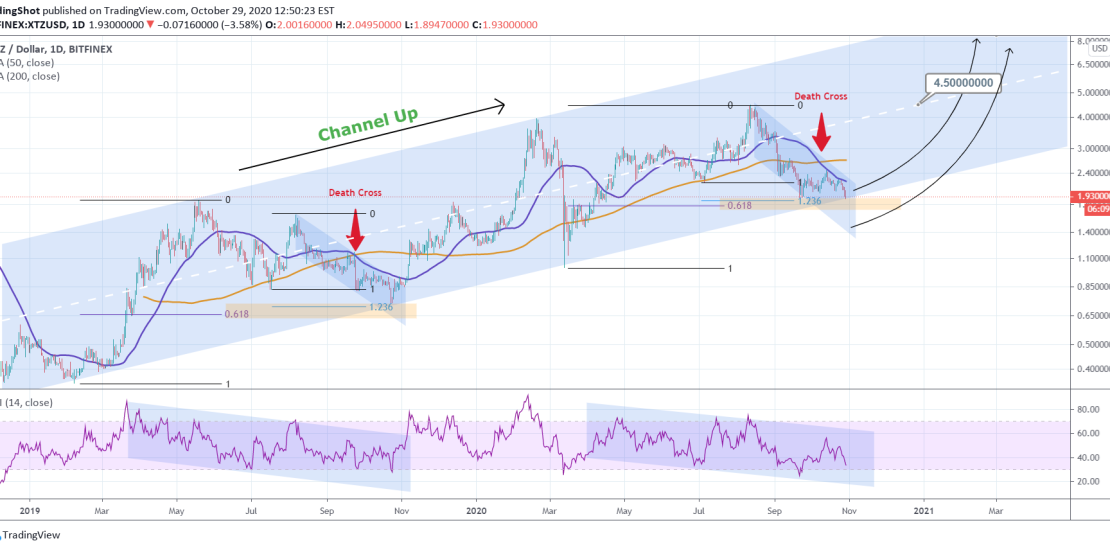
Pattern: Channel Up on 1D. Signal: Buy as the price is testing the Higher Low trend-line of the Channel, following a Death Cross, being on the 0.618/ 1.236 Fib aggregate that previously was a buy zone. Target: 4.500 (Resistance) and in extension 8.500 (Higher High of the Channel Up) TA very successful on previous
-
Bitcoin and U.S. elections. What does the past tell us?
- October 26, 2020
- Posted by: Tradingshot Articles
- Category: Cryptocurrency
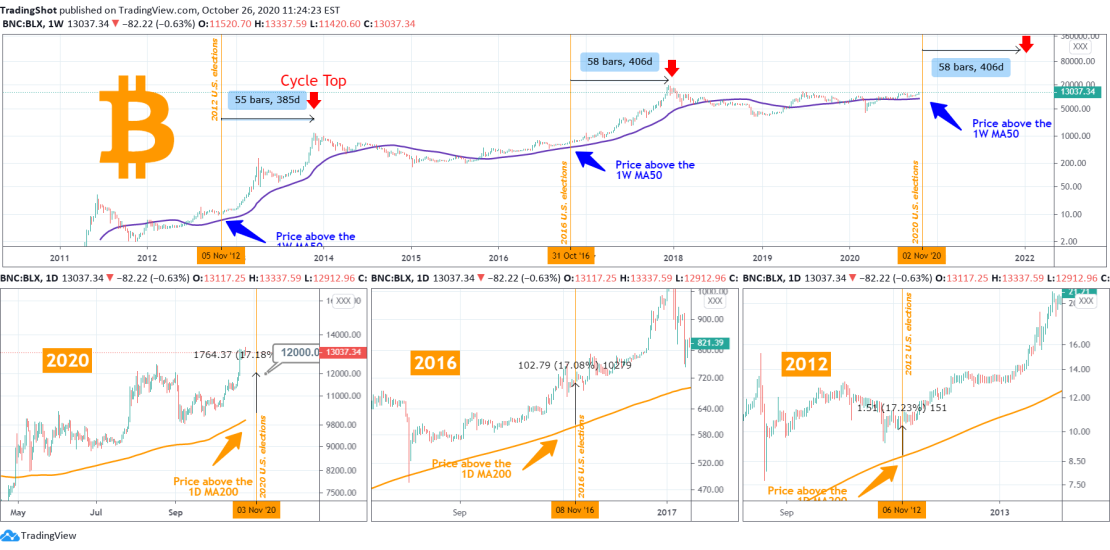
Undoubtedly the most important event of the upcoming week are the U.S. Presidential elections. We have seen in the past the high impact that the result has on the financial markets and Bitcoin is no exception, especially in late years where it is more correlated with the stock market than ever before. So how
-
DOW JONES Recurring bullish pattern on the 1W time-frame?
- October 23, 2020
- Posted by: Tradingshot Articles
- Category: Stock Indices
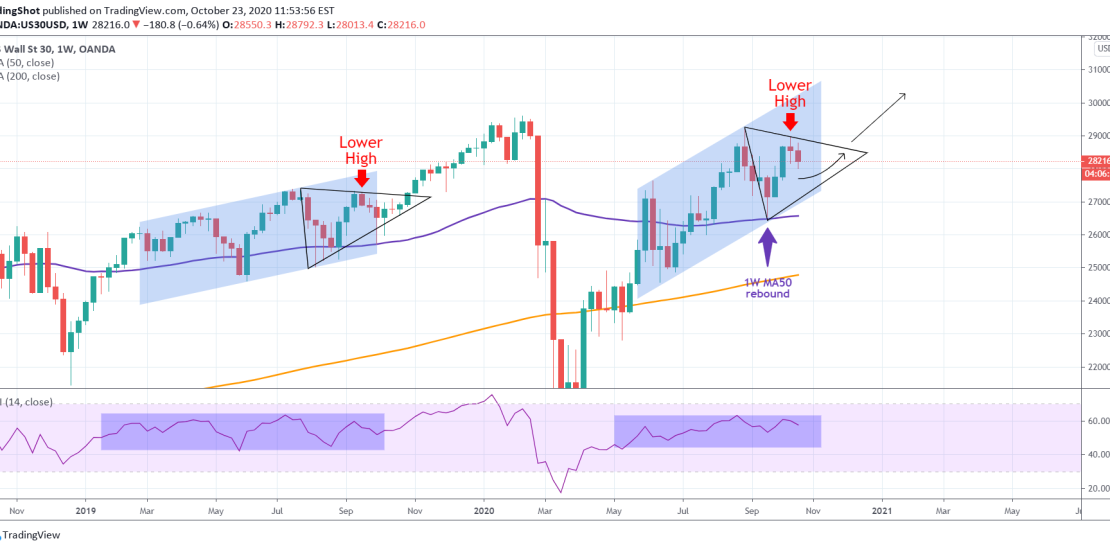
The Channel Up since June has fairly the same basic structure (even though more aggressive) than the one from March to September 2019, which led to the pre-COVID All Time High. That pattern ended with a Lower High than created a Triangle, which eventually broke to the upside to the ATH. Dow Jones made
-
ETHEREUM on the weekly chart. Is $600 achievable?
- October 23, 2020
- Posted by: Tradingshot Articles
- Category: Cryptocurrency
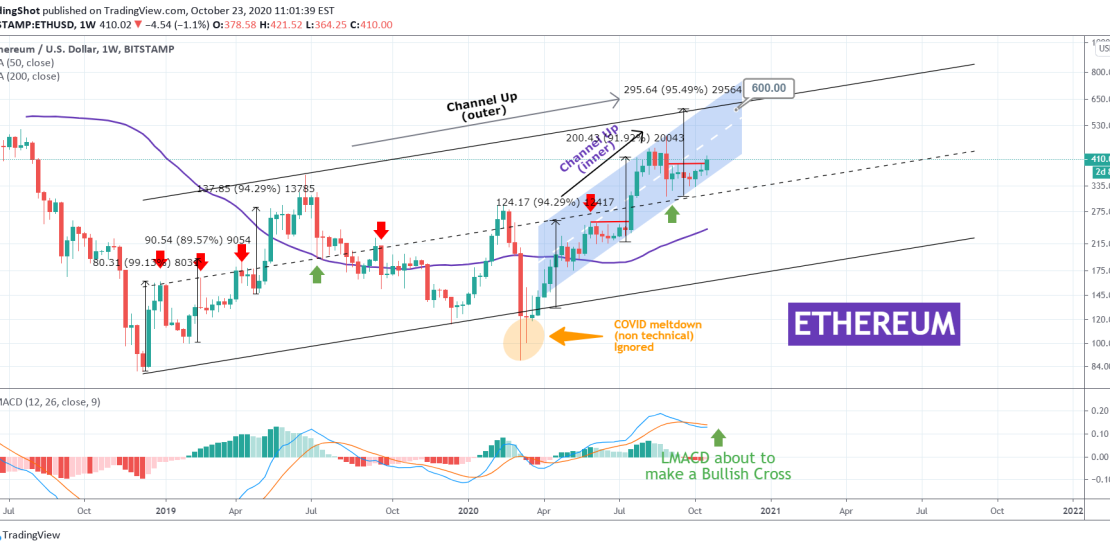
Last week I posted the following chart on Ethereum: ** The Inner Channel Up ** It was about the final Resistance level of 400 that ETH had to break before its April Channel Up (inner/ blue) on the 1D chart turned bullish again. Well it happened, as the 1D MA50 turned into Support, and
-
OIL Trading Plan
- October 22, 2020
- Posted by: Tradingshot Articles
- Category: Commodities
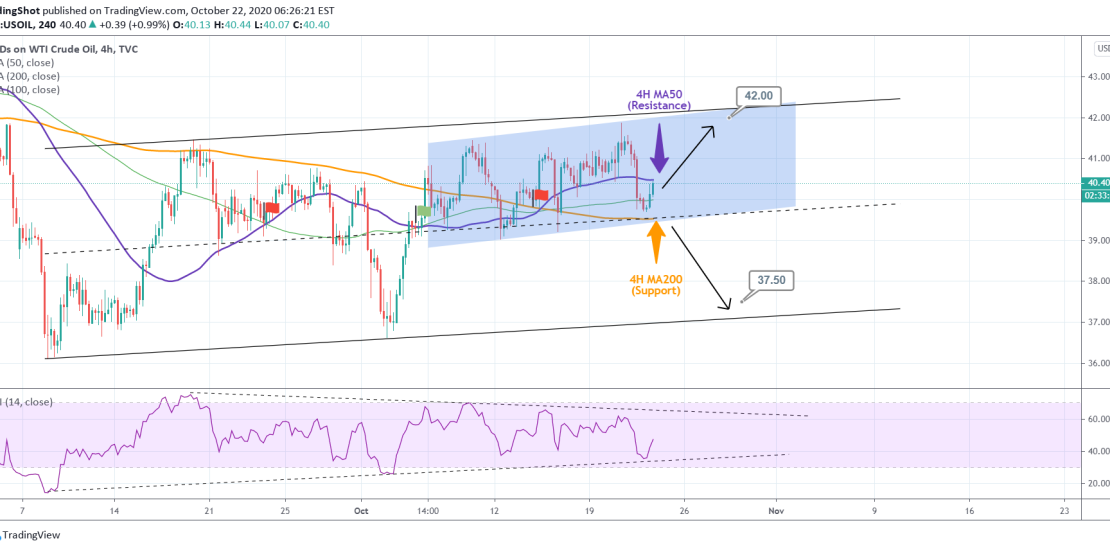
Pattern: Channel Up on 4H (inner/ blue and outer/ black lines). Signal: (A) Buy as long as the 4H MA200 is holding, (B) Sell if the 4H MA200 breaks. Target: (A) 42.00 (just under the Higher High trend-lines of both Channels), (B) 37.50 (just above the Higher Low trend-line of the inner (blue) Channel
-
EURUSD Waiting for a pull-back to enter
- October 21, 2020
- Posted by: Tradingshot Articles
- Category: Forex
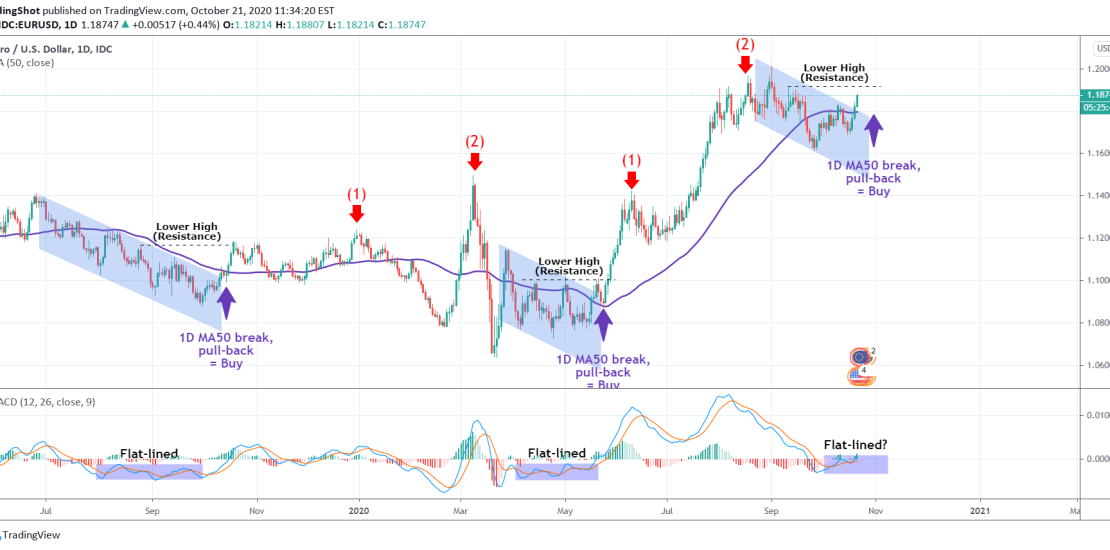
Another MA approach, this time on EURUSD. It is a recurring pattern since mid-2019: The 1D chart posts a Channel Down with the price action diving below the 1D MA50 (blue line). The MACD is flat-lined and once it breaks above this range and the price above the 1D MA50, one final pull-back occurs
-
BITCOIN testing the Underlying Trendline again. $14300 possible?
- October 20, 2020
- Posted by: Tradingshot Articles
- Category: Cryptocurrency
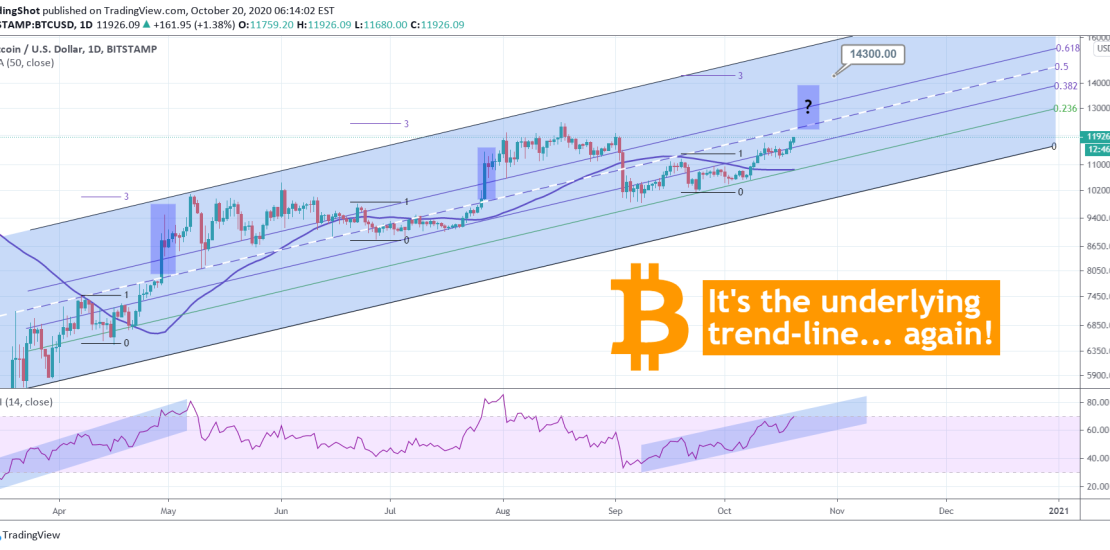
So Bitcoin has started to show some activity again. Do you remember the ‘Underlying Trend-line’ which I initially published in June and revised in July? At that time, I called it “the most consistent trend-line since March”: Guess what. Not only does it still remain relevant to this day but also BTC is testing

