

-
GBPUSD Buy Signal
- November 4, 2019
- Posted by: Tradingshot Articles
- Category: Uncategorized
No Comments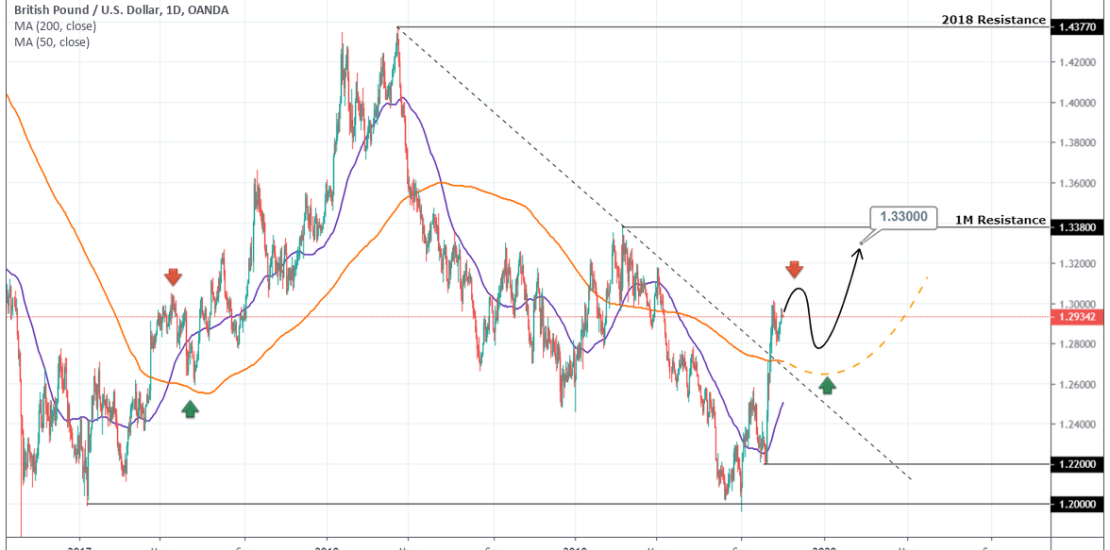
Pattern: Channel Up on 1D. Signal: Bullish on the next pull back near the 1D MA200 base on a similar candle sequence in 2017. Target: 1.33000 (right below the 1M Resistance). Tradingview link: https://www.tradingview.com/chart/GBPUSD/vKdRYFFY-GBPUSD-Buy-Signal
-
EURZAR Sell Signal
- October 31, 2019
- Posted by: Tradingshot Articles
- Category: Uncategorized
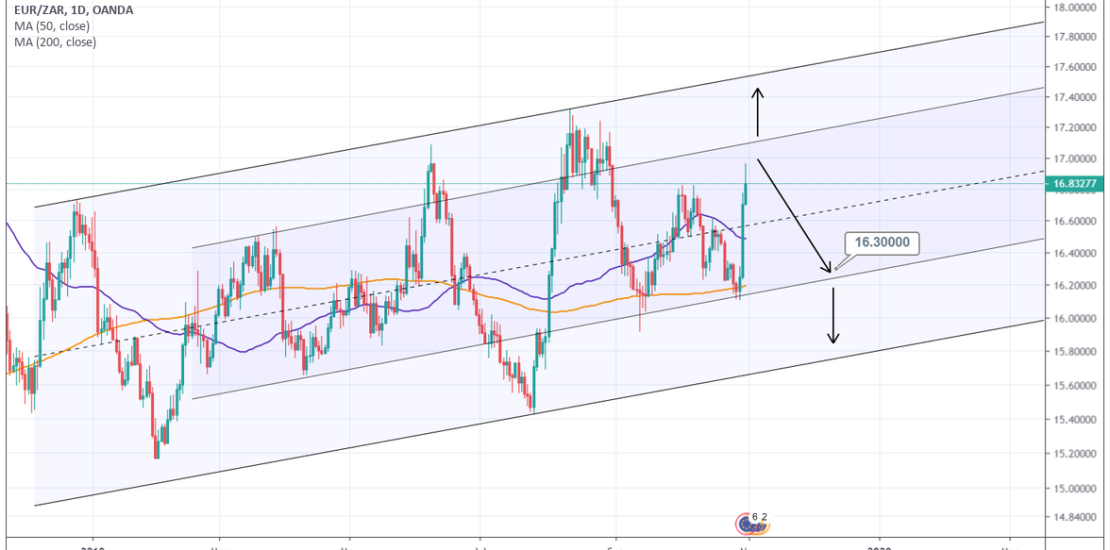
Pattern: 1M Channel Down. Signal: Bearish as the price is near the inner Higher Low trend line. Target 16.3000. Tradingview link: https://www.tradingview.com/chart/EURZAR/TrDUDUBw-EURZAR-Sell-Signal
-
NASDAQ Buy Signal to $8900
- October 30, 2019
- Posted by: Tradingshot Articles
- Category: Uncategorized
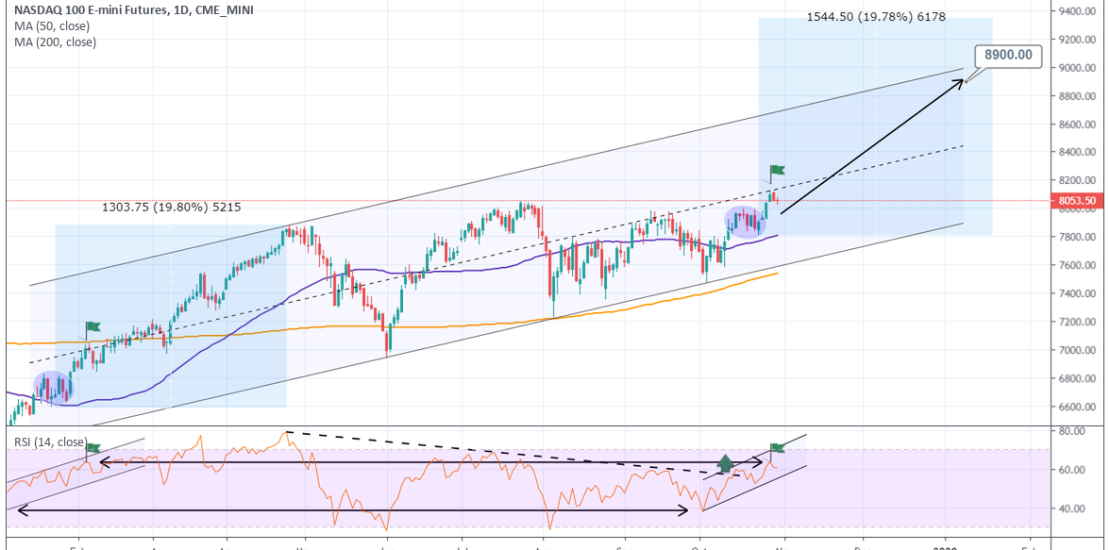
Pattern: Channel Up on 1M. Signal: Bullish as the RSI on 1D made a bullish break out above the Lower High trend line (dashed) and is replicating the start of the year pattern. Target: $8900. Tradingview link: https://www.tradingview.com/chart/NQ1!/YDWMtHs0-NASDAQ-Buy-Signal-to-8900
-
S&P500 Bullish break out
- October 30, 2019
- Posted by: Tradingshot Articles
- Category: Uncategorized
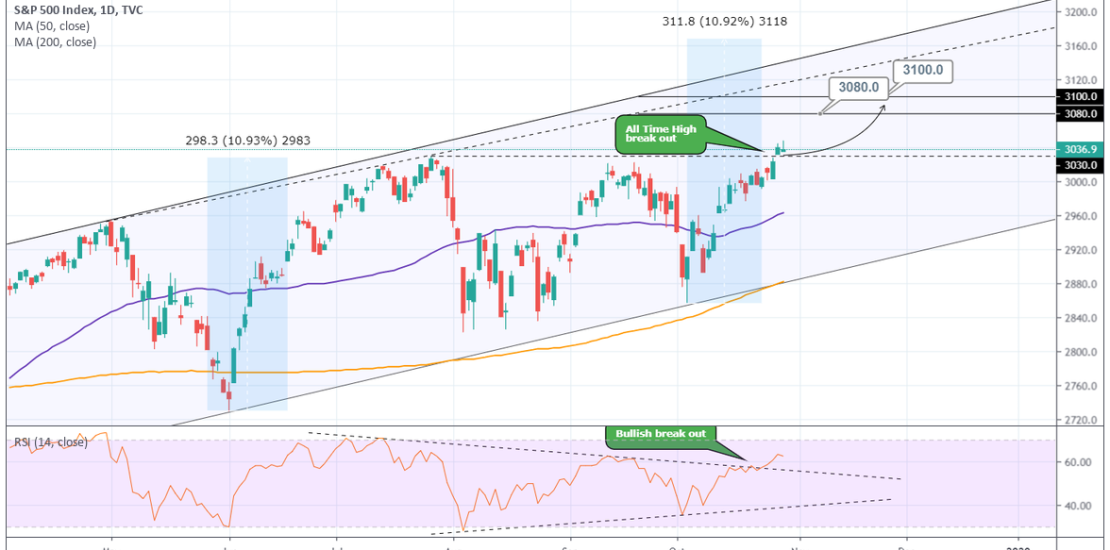
Pattern: 1W Channel Up. Signal: Bullish as the 3030 All Time High broke on a 1D bullish break out. Target: 3080 and 3100 in extension. Tradingview link: https://www.tradingview.com/chart/SPX/D2aFMBYS-S-P500-Bullish-break-out
-
USDILS Sell Signal
- October 22, 2019
- Posted by: Tradingshot Articles
- Category: Uncategorized
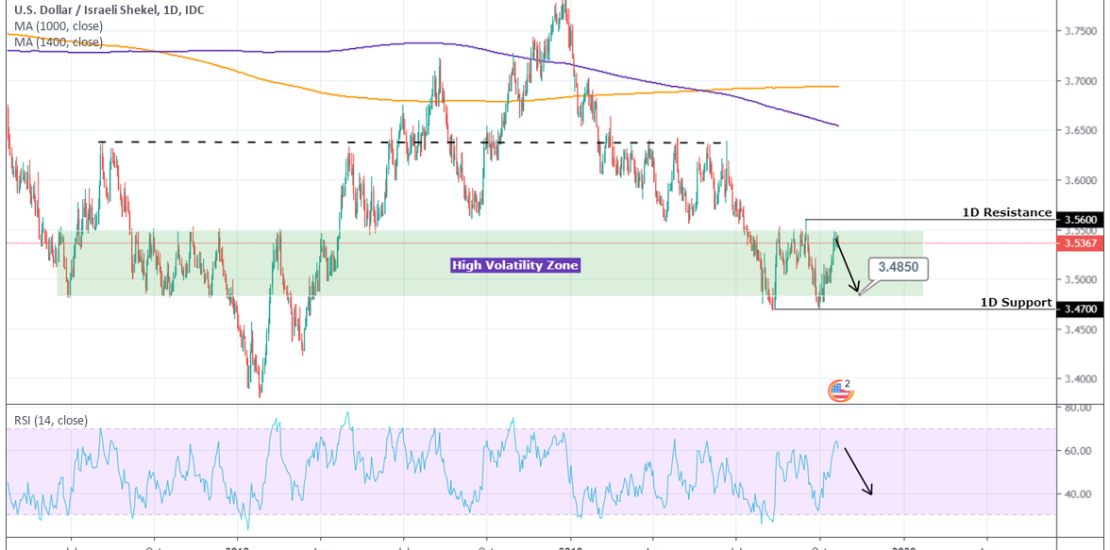
Pattern: Rectangle on 1D (3.4700 – 3.5600). Signal: Bearish as the price is at the top of the High Volatility zone and the RSI has peaked. Target: 3.4850 (bottom of the High Volatility zone). Tradingview link: https://www.tradingview.com/chart/USDILS/7WYmncyL-USDILS-Sell-Signal
-
USDCAD Buy Signal
- October 22, 2019
- Posted by: Tradingshot Articles
- Category: Uncategorized
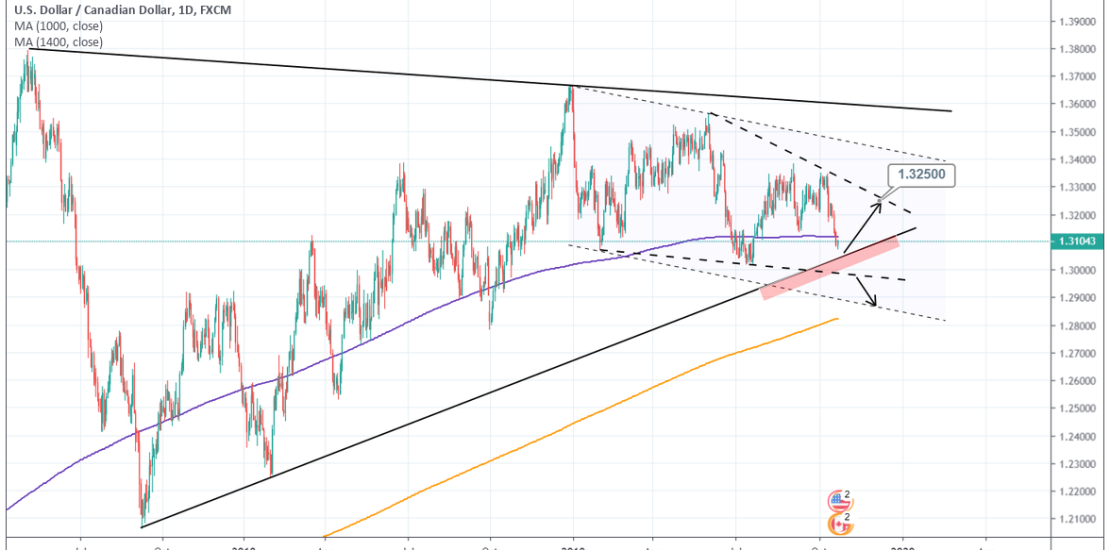
Pattern: Triangle on 1M. Signal: Bullish if the price rebounds above the Higher Low zone (red rectangle). Target: 1.32500 (Lower High suggested by the dashed Falling Wedge). Tradingview link: https://www.tradingview.com/chart/USDCAD/lyaSG3AS-USDCAD-Buy-Signal
-
NZDCHF Buy Signal
- October 21, 2019
- Posted by: Tradingshot Articles
- Category: Uncategorized
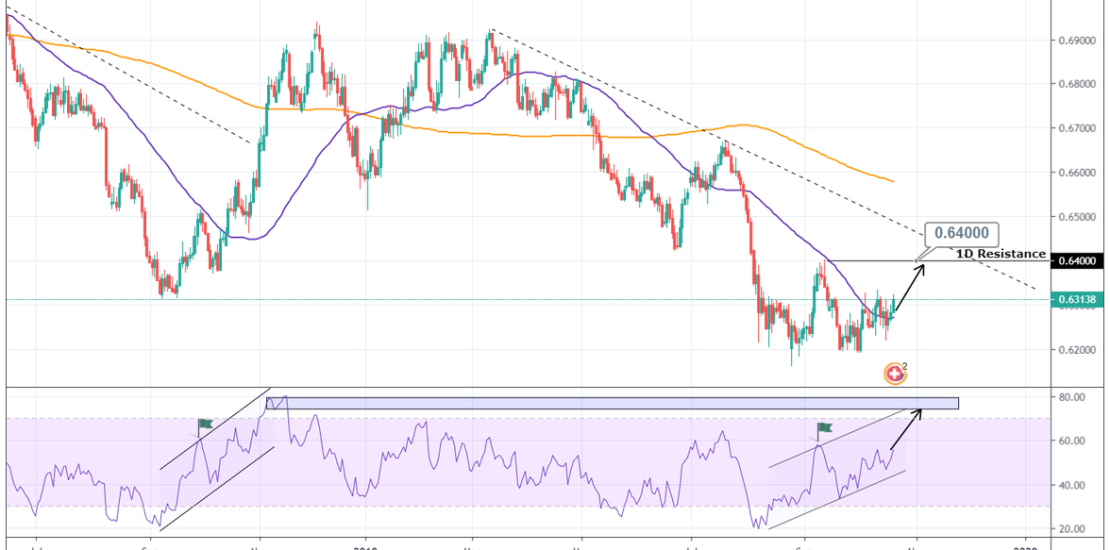
Pattern: Channel Up on 1D. Signal: Bullish due to an identical RSI occurrence. Target: 0.6400 (1D Resistance). Tradingview link: https://www.tradingview.com/chart/NZDCHF/2IreLLGx-NZDCHF-Buy-Signal
-
EURUSD Sell Signal (long term)
- October 18, 2019
- Posted by: Tradingshot Articles
- Category: Uncategorized
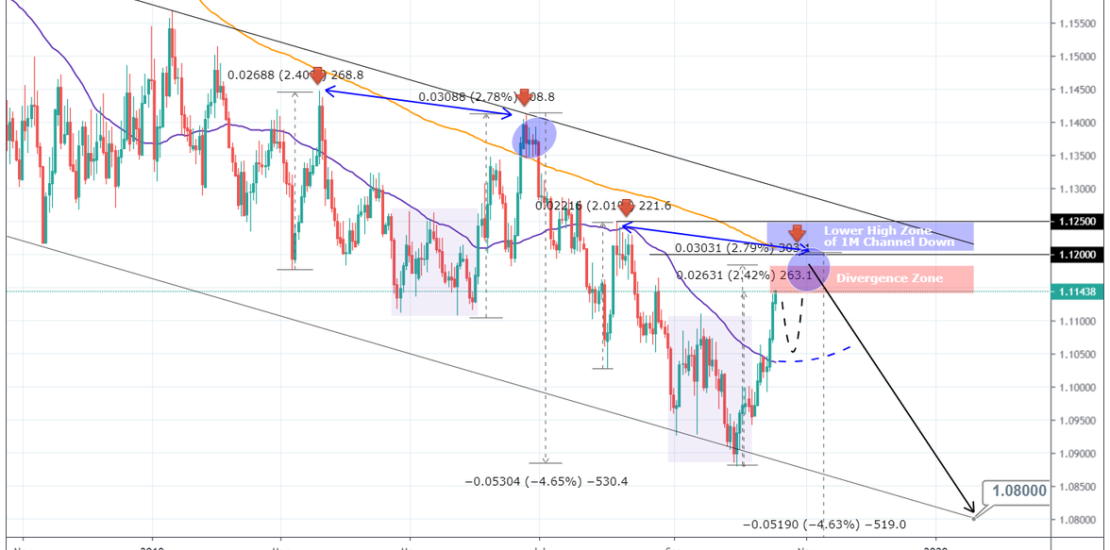
Pattern: Channel Down on 1M. Signal: Bearish as the price has entered the Lower High divergence zone (if the current is also -0.40% lower from the March – June Lower High range). Target: 1.0800 (even though the -4.65% extension can go as low as 1.0700). NOTE: The same pattern has been followed in the
-
USDHUF Buy Signal
- October 17, 2019
- Posted by: Tradingshot Articles
- Category: Uncategorized
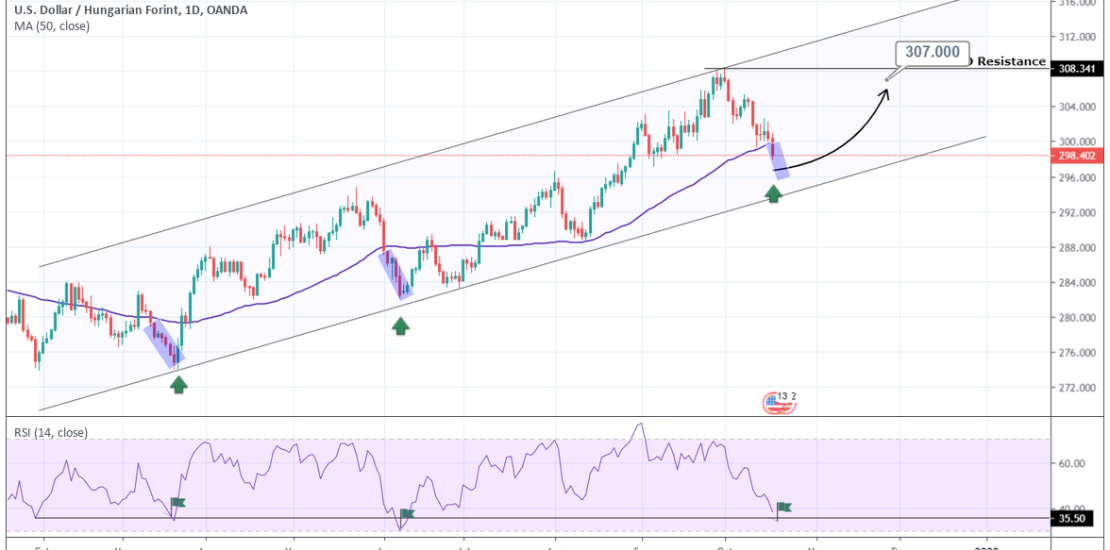
Pattern: Channel Up on 1W. Signal: Bullish as the price broke below the 1D MA50. Target: 307.000 (just under the 1D Resistance). Tradingview link: https://www.tradingview.com/chart/USDHUF/utm6d7i9-USDHUF-Buy-Signal
-
XTZBTC Buy Signal. Big upside potential.
- October 17, 2019
- Posted by: Tradingshot Articles
- Category: Uncategorized
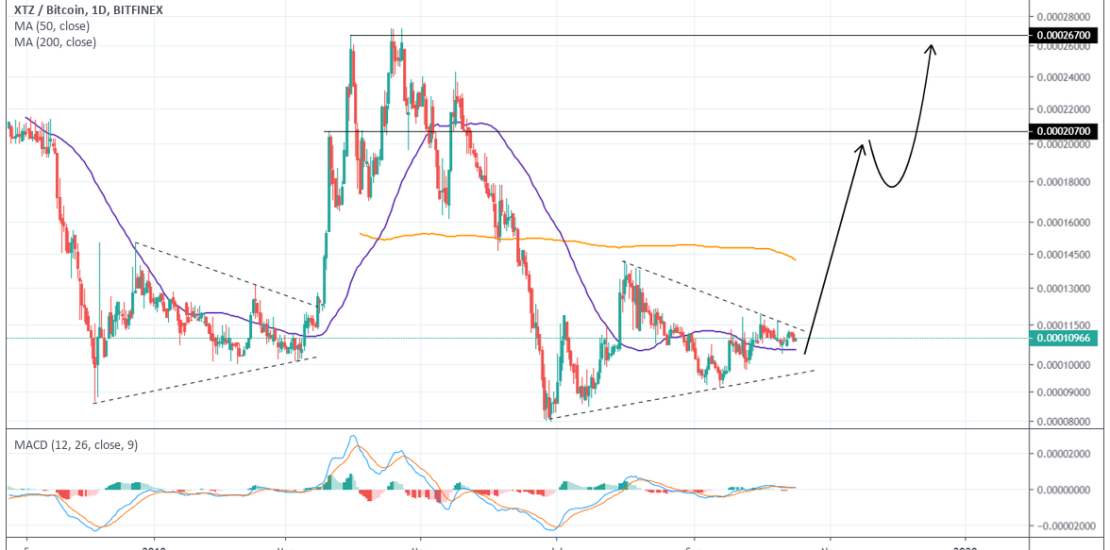
Pattern: Triangle on 1D. Signal: Bullish as the pattern is about to break out to the upside on a similar manner to the early 2019 formation. Target: 0.000207 and 0.000267 in extension. Tradingview link: https://www.tradingview.com/chart/XTZBTC/hXxIbyg2-XTZBTC-Buy-Signal-Big-upside-potential