
-
US10Y Bullish structure on the 10 year Bond yields
- January 14, 2021
- Posted by: Tradingshot Articles
- Category: Uncategorized
No Comments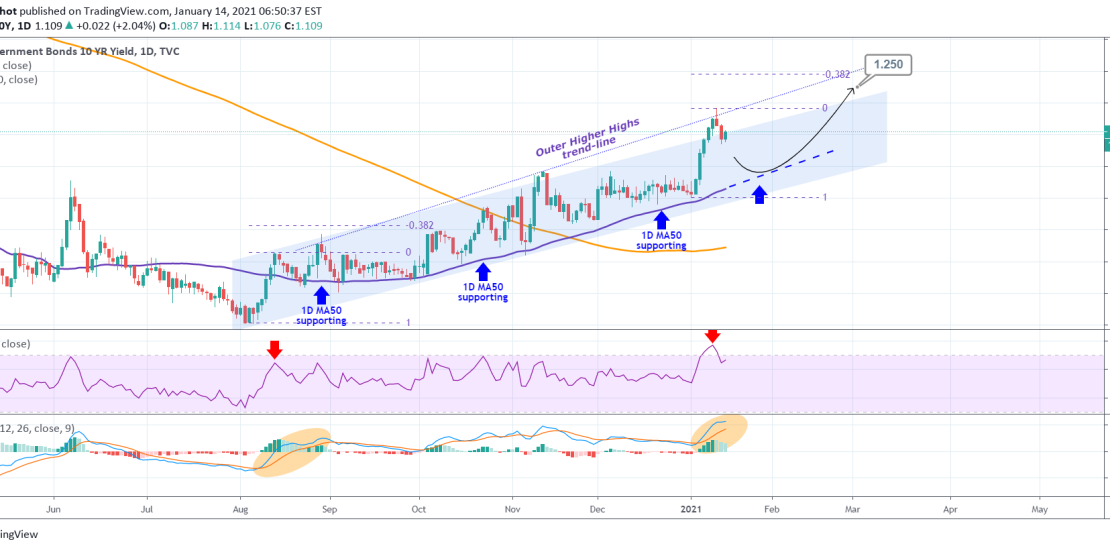
Pattern: Channel Up on 1D. Signal: Buy once the price approaches the 1D MA50 (blue trend-line) which has been the most consistent buy entry since mid August. Also based on both the 1D RSI and MACD, the August leg is currently repeated. Target: 1.250 (just under the Outer Higher Highs trend-line and the 0.382 Fibonacci
-
S&P aiming for 4070 – 4200 by March
- January 12, 2021
- Posted by: Tradingshot Articles
- Category: Uncategorized
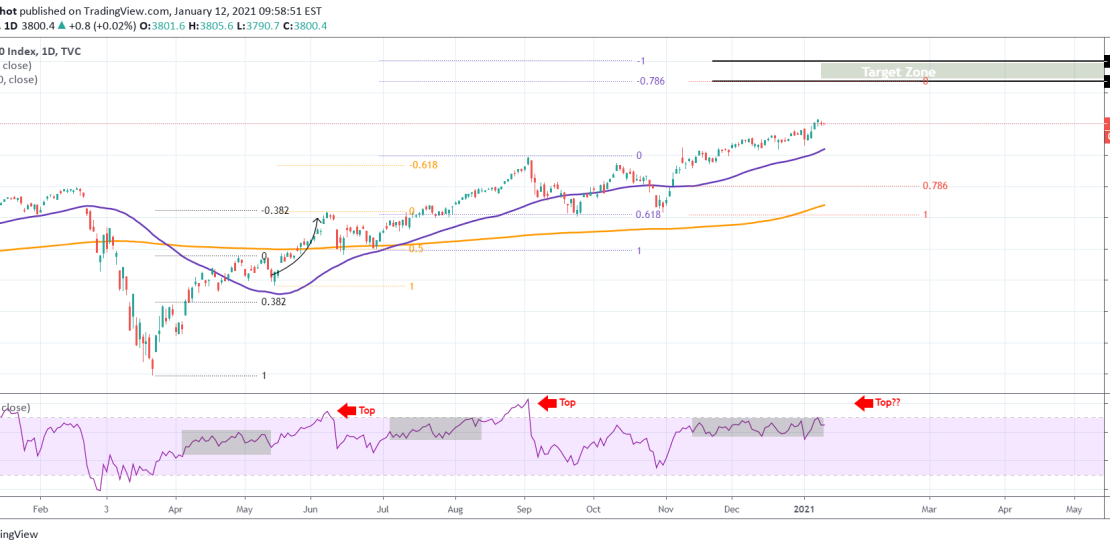
Purely RSI and Fibonacci extension based analysis. As you see since the March bottom every Higher High is on a higher Fib extension (0.382, 0.618). Similarly, the Higher Lows have so far followed a 0.382, 0.5, 0.618 Fibonacci retracement sequence. The RSI is currently trading sideways since mid November. In the previous two Fib
-
ADAUSD is looking for the 1D MA50
- January 8, 2021
- Posted by: Tradingshot Articles
- Category: Uncategorized
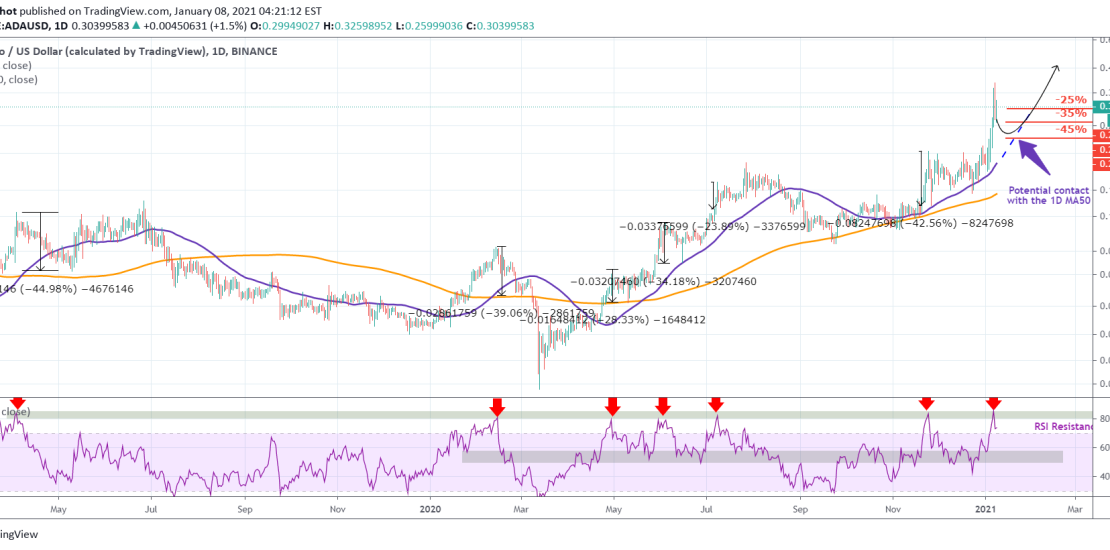
Cardano is one of the coins that has seen extraordinary gains already during the first week of the year. However as most coins did, it is seeing a retracement since yesterday. That shouldn’t come as a surprise as on the 1D time-frame, the RSI hit a Resistance Zone that is holding since January 2018!
-
BITCOIN Trust the 4H MA50/MA200 pattern
- January 3, 2021
- Posted by: Tradingshot Articles
- Category: Cryptocurrency, Uncategorized
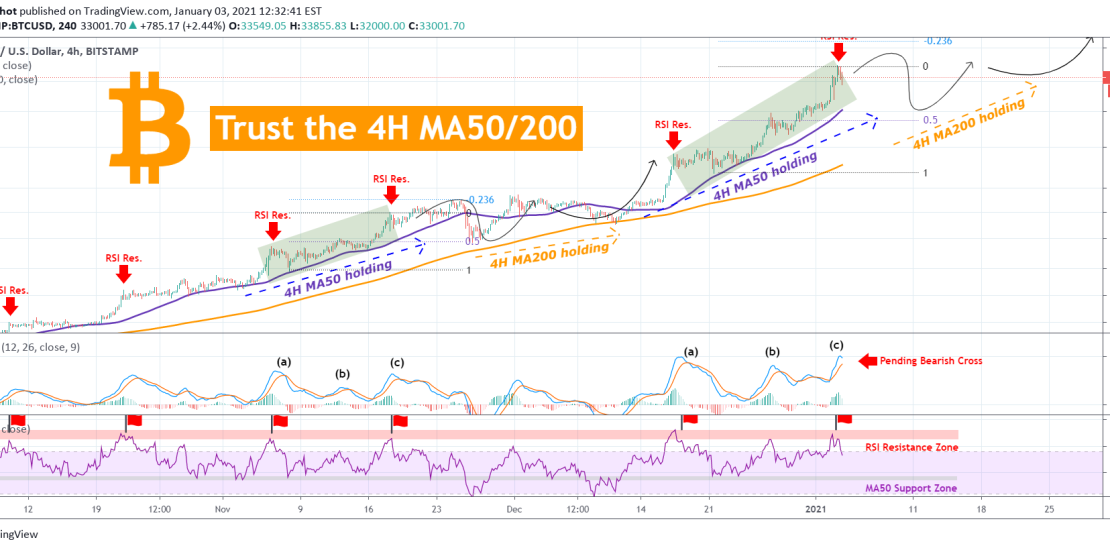
First of all congratulations hodlers. Another benchmark, the very important $30000, has been breached! There is every reason to be excited yet again, but rest assured, there are also several signs and patterns to consider for this 1st month of 2021. Today Bitcoin made yet another high, almost hitting $35k, but since we see a
-
XRPUSD Great opportunity could be a little lower
- December 29, 2020
- Posted by: Tradingshot Articles
- Category: Uncategorized
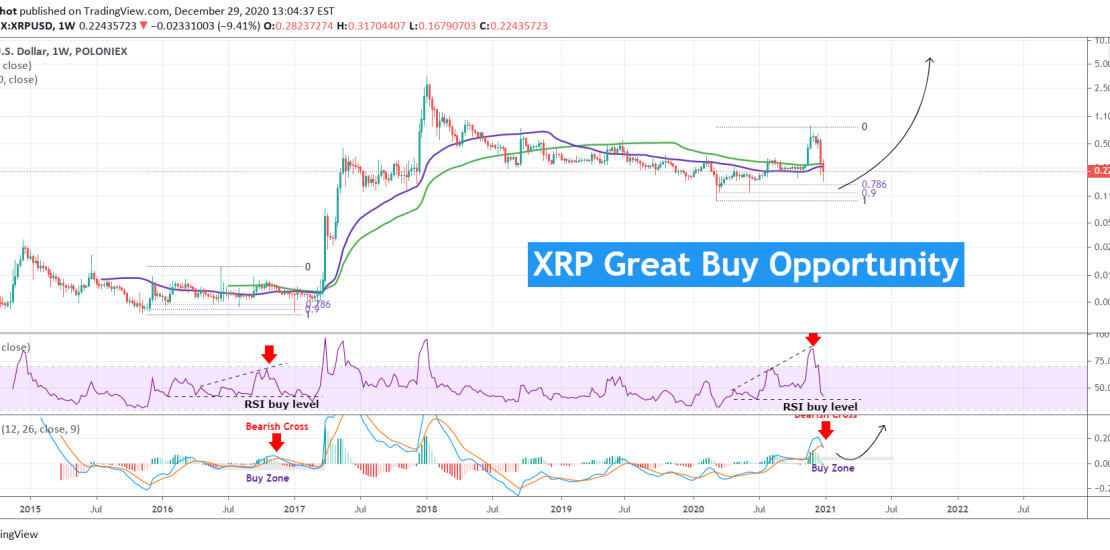
A lot of talk is being done lately on XRP and its recent sharp sell-off that took most traders by surprise. This panic selling is fundamentally driven by the recent news and I believe the tension isn’t over yet. Today I want to focus on the technicals though and the 1W chart. This shows
-
Will the stock market decline if DXY holds this Support?
- December 22, 2020
- Posted by: Tradingshot Articles
- Category: Uncategorized
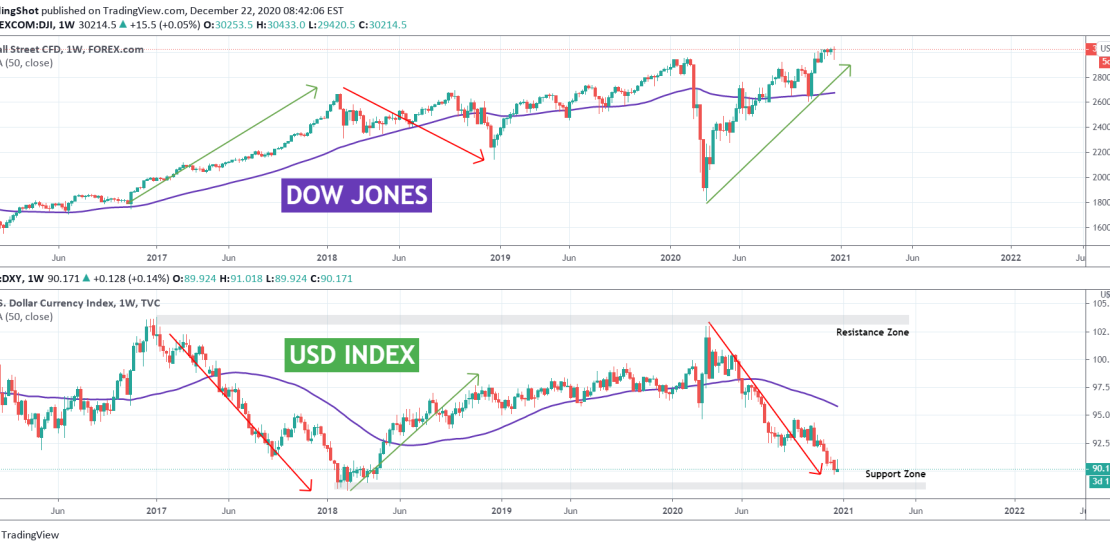
This is a simple yet very informative study showing a comparison of Dow Jones against DXY (U.S. Dollar Index). Since early 2015 the DXY has been ranging (wide range but still range) and especially after 2017 it established a clear Resistance (103.800 – 103.000) and Support (88.200 – 88.900) Zone. Every time it hit
-
XRPUSD Bullish Cross on the LMACD. Eyes on $0.400.
- September 15, 2020
- Posted by: Tradingshot Articles
- Category: Uncategorized
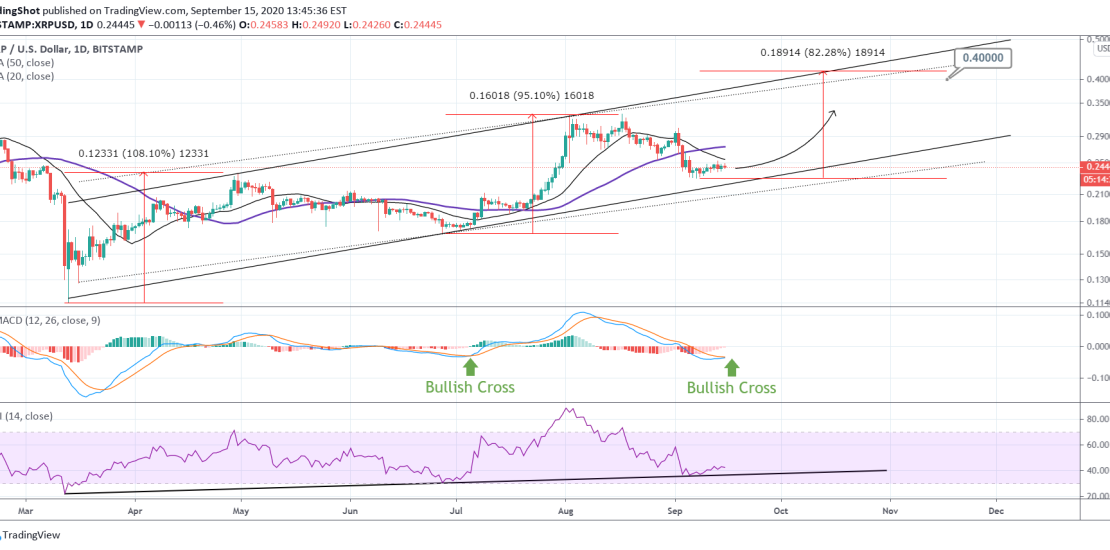
Ripple is trading within a Channel Up since the March bottom. The price is currently consolidating near the Higher Low trend-line but the LMACD has just made a Bullish Cross. Last time that happened, XRP touched the Higher Low trend-line and started the aggressive rebound towards the Higher High trend-line. Notice also how the
-
WTI OIL Buy Signal
- September 15, 2020
- Posted by: Tradingshot Articles
- Category: Uncategorized
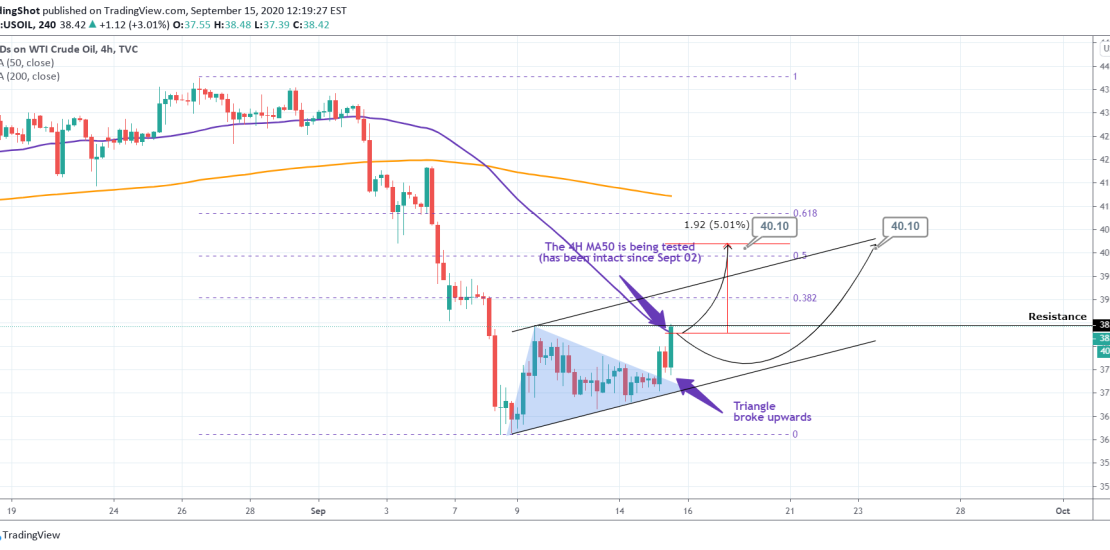
Pattern: Triangle into Channel Up. Signal: Bullish as the Triangle broke, the 4H MA50 has been crossed and the 38.45 Resistance is being tested. Target: 40.10, that is roughly a +5% rise from the 4H MA50 break-out. Sinc June 16, every break-out above the 4H MA50 has resulted into at least a +5.50% rally. **
-
S&P We may be starting a new 10 year Bull Cycle!
- September 13, 2020
- Posted by: Tradingshot Articles
- Category: Uncategorized
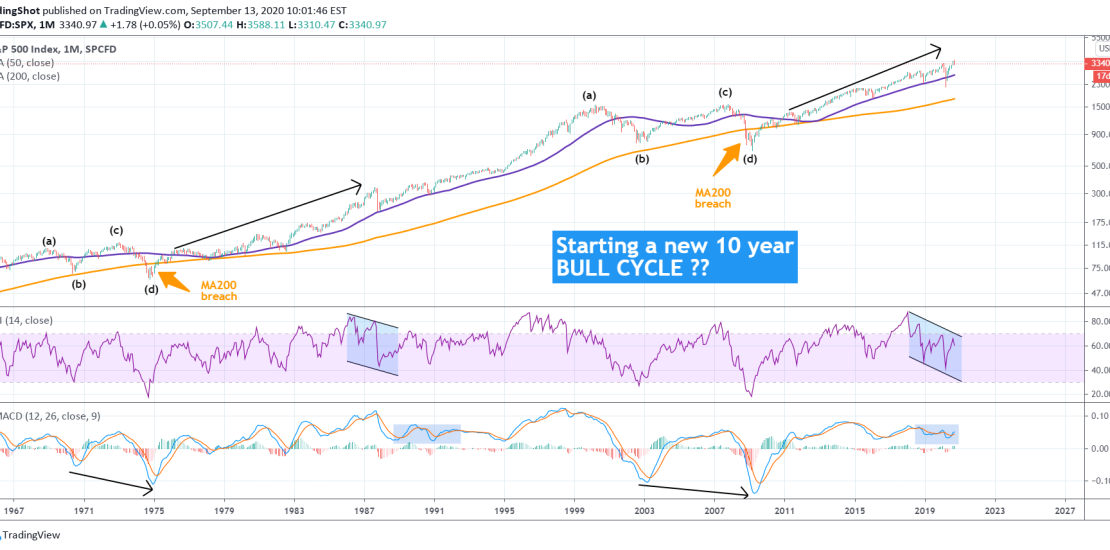
S&P’s weakness in recent weeks has got many thinking that the rally since the March correction is over and that maybe a new round of selling is ahead of us. On such occasions I have found it extremely useful to consult very long-term time-frames (such as the 1M in this instance) and look how
-
ETHEREUM Indications that the Bull Rally is starting
- July 23, 2020
- Posted by: Tradingshot Articles
- Category: Uncategorized
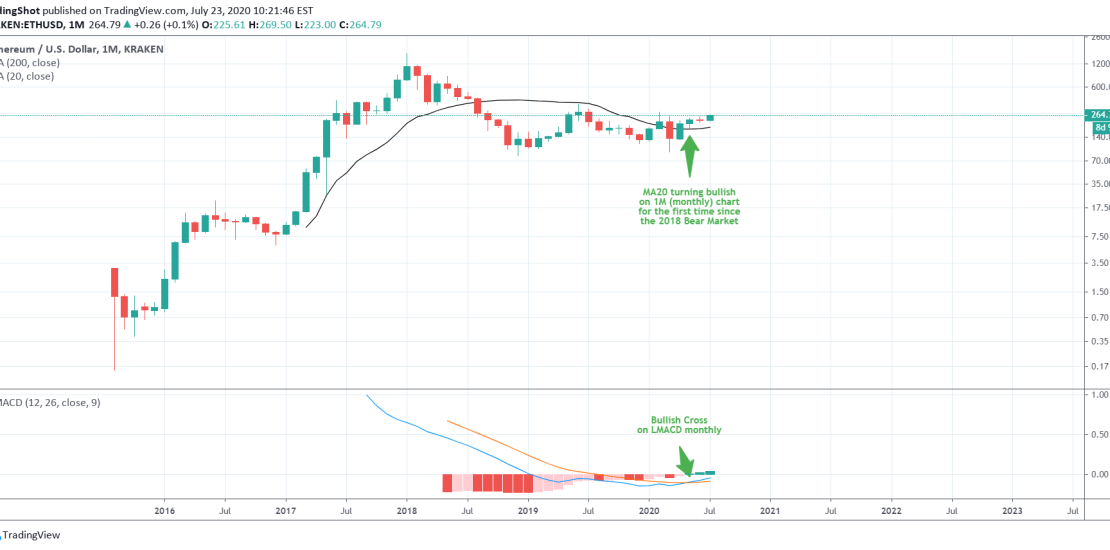
Another simple study on ETHUSD making use of the MA20 and the LMACD on the 1M (monthly) chart. As you see both showcase strong bullish signals. In particular, the LMACD made a Bullish Cross in May but the important thing is that Ethereum has been making Higher Highs since, indicating a sustainable uptrend. On
