

-
OIL Trading Plan
- July 21, 2020
- Posted by: Tradingshot Articles
- Category: Uncategorized
No Comments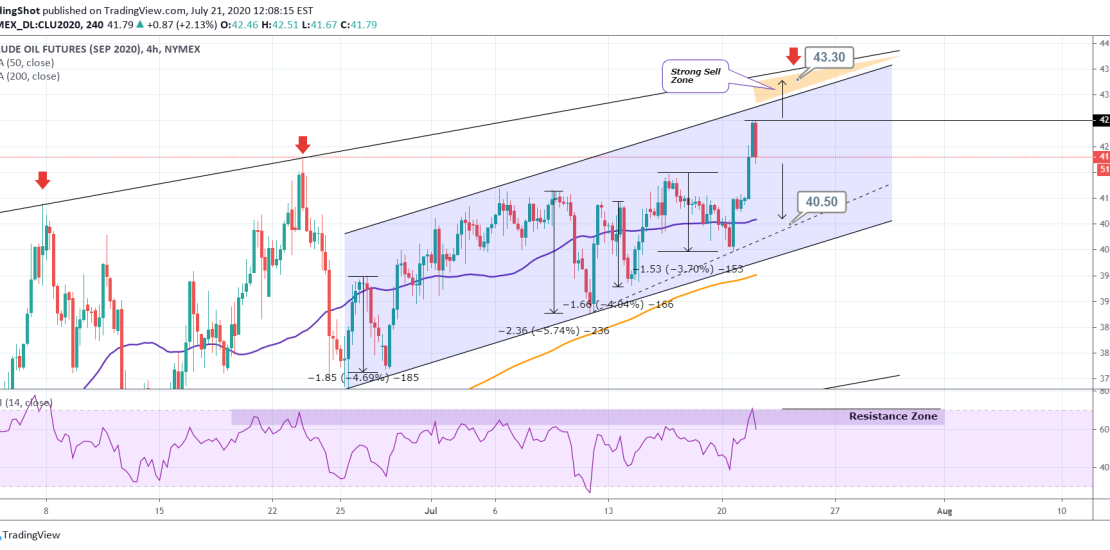
Pattern: Channel Up on 4H. Signal: (A) Bearish as long as the 42.50 Resistance holds, (B) Bullish if it breaks. Target (A) 43.30 (Higher High of the wider Channel Up), (B) 40.50 (just below the 4H MA50 and above the dashed Higher Low trend-line) ** Please support this idea with your likes and comments,
-
USDKRW A long-term approach
- July 16, 2020
- Posted by: Tradingshot Articles
- Category: Uncategorized
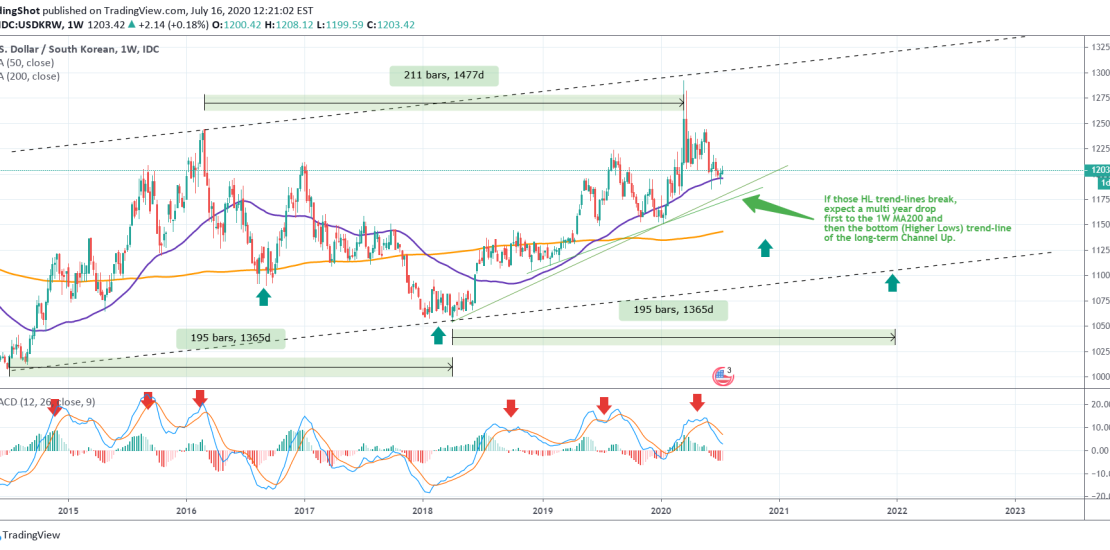
Pattern: Multi-year Channel Up on 1W since mid 2014. Signal: If the green trend-lines break, it is a sell signal but suitable to long-term traders only. Target: First to the 1W MA200 and then the Higher Lows trend-line of the long-term Channel Up as illustrated by the green arrows. ** Please support this idea
-
GBPCAD Buy Signal
- June 10, 2020
- Posted by: Tradingshot Articles
- Category: Uncategorized
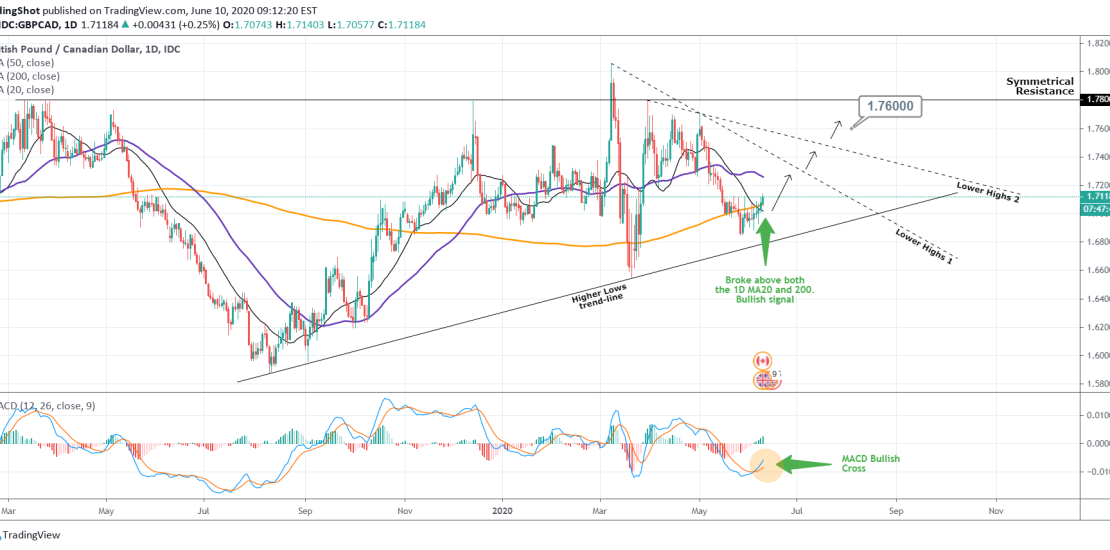
Pattern: Triangle on 1D. Signal: Bullish as: a) the MACD made a Bullish Cross, b) the price broke above both the 1D MA20 and 200. Target: 1.7600 (below the Symmetrical Resistance). Make sure to book profits if you see the price struggling on any of the two Lower Highs trend-lines. ** Please support this
-
XRPUSD Two good case scenarios: $0.24 and $0.30.
- March 23, 2020
- Posted by: Tradingshot Articles
- Category: Uncategorized
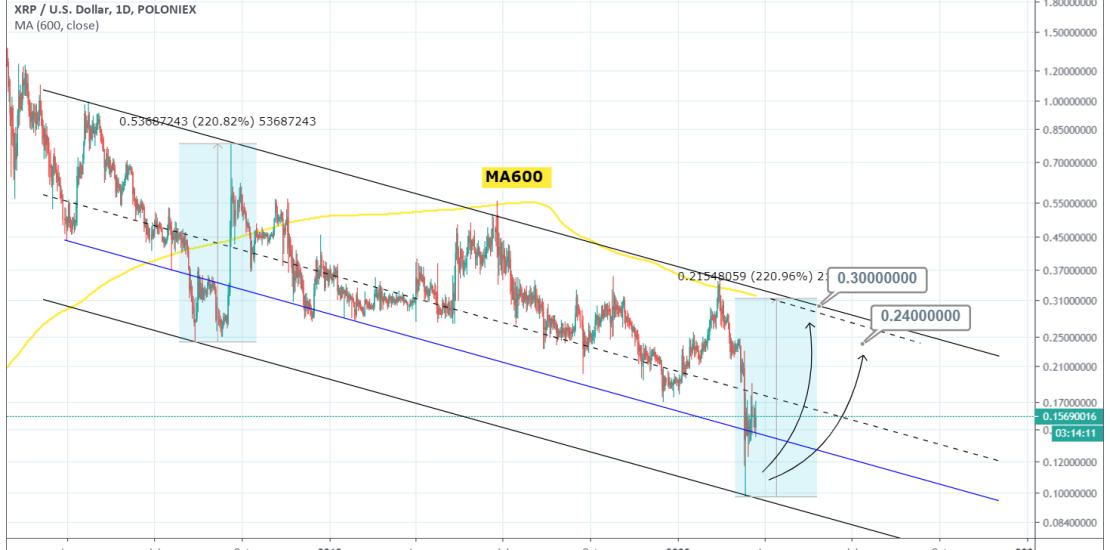
Going way back in mid 2018 the pattern is a Channel Down. For most of the pattern’s lifetime the price has been trading above the median with a level just below (blue line) working as the Support. That is except for two occasions where a Lower Low was made: August 2018 and recently March
-
EURUSD Action plan
- March 19, 2020
- Posted by: Tradingshot Articles
- Category: Uncategorized
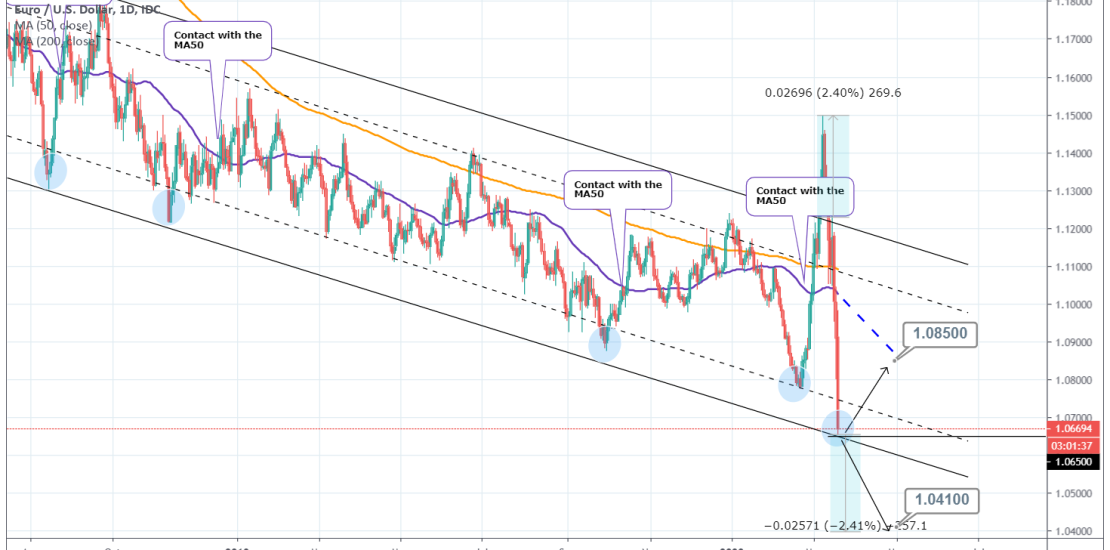
Pattern: Channel Down on monthly since June 2018. Signal: (a) Bullish as long as 1.06500 holds, (b) Bearish if it breaks (potential pattern breakdown symmetrical to the break upwards earlier this month). Target: (a) 1.08500 (potential contact with the 1D MA50 (b) 1.04100 (the -2.40% decline similar to the +2.40% outside of the pattern occurred
-
GBPUSD This feels like the Brexit sell-off
- March 18, 2020
- Posted by: Tradingshot Articles
- Category: Uncategorized
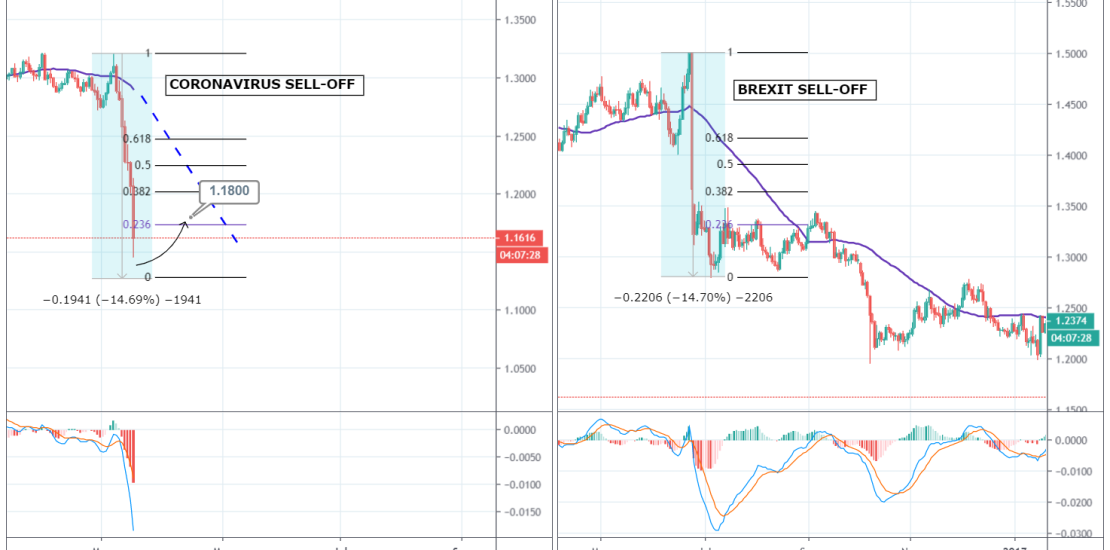
The current sell-off is similar to the Brexit shock on GBPUSD on June 24, 2016. Once the price got detached from the 1D MA50 it declined nearly -15% from the top. The reaction at the bottom was a pull back to the 0.236 Fibonacci level. The new (lower) High was confirmed by the MACD roll-over.
-
GBPEUR Sell Signal
- January 14, 2020
- Posted by: Tradingshot Articles
- Category: Uncategorized
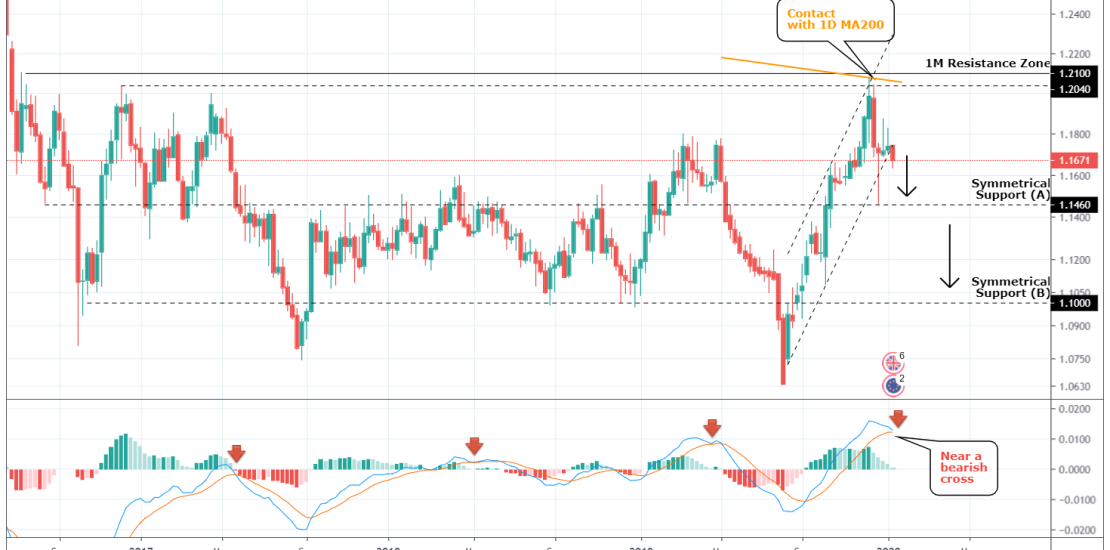
Pattern: Channel Up on 1W (dashed channel). Signal: Bearish as after the price failed to cross the 1M Resistance Zone, it got rejected on the 1D MA200 and the Channel Up broke to the downside. MACD also rolling over. Target: 1.1460 (symmetrical Support A) and 1.1000 (symmetrical Support B). Tradingview link: https://www.tradingview.com/chart/GBPEUR/Kc9sLgk2-GBPEUR-Sell-Signal
-
CADJPY Sell Signal
- November 12, 2019
- Posted by: Tradingshot Articles
- Category: Uncategorized
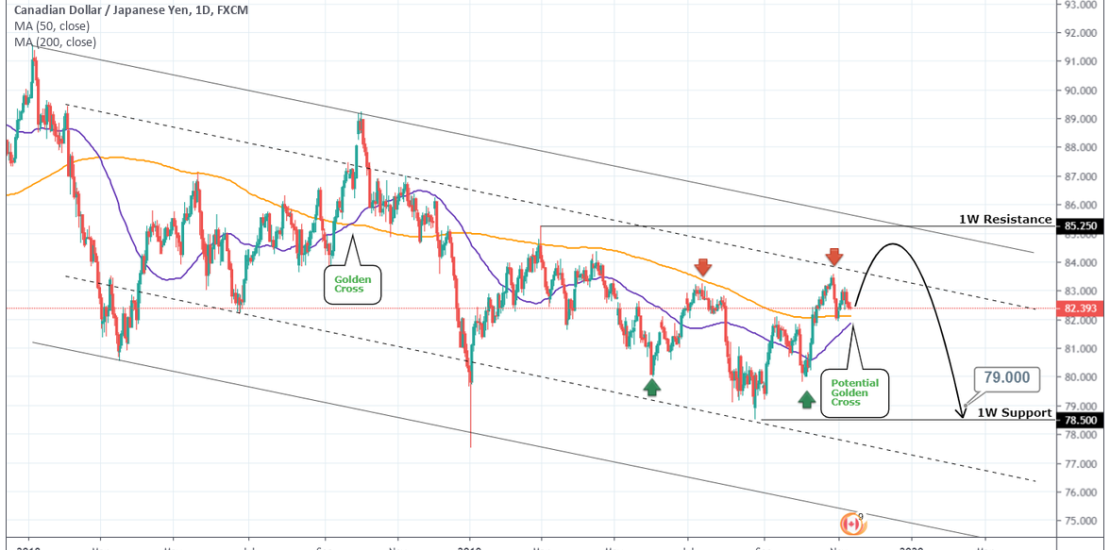
Pattern: 1M Channel Down. Signal: Bearish once the Lower High is made (near the 1W Resistance) after the 1D Golden Cross takes place. Target: 79.000. Tradingview link: https://www.tradingview.com/chart/CADJPY/1nhpjfd6-CADJPY-Sell-Signal
-
CHFPLN Action Plan
- November 11, 2019
- Posted by: Tradingshot Articles
- Category: Uncategorized
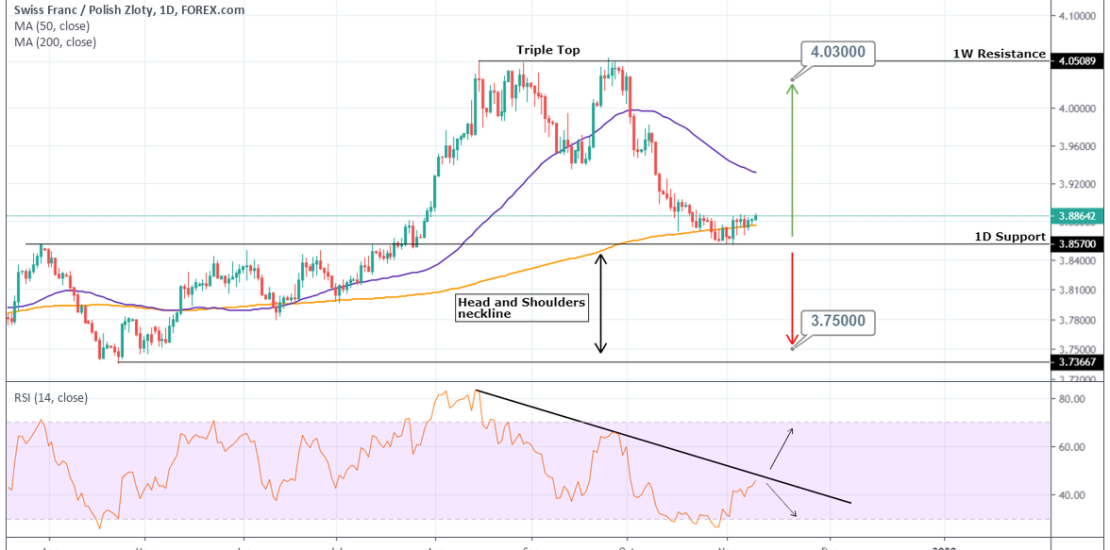
Pattern: Potential Head and Shoulders on 1W. Signal: (A) Bearish if the 3.85700 1D Support breaks, (B) bullish if it holds. Target: (A) 3.75000, (B) 4.03000. Tradingview link: https://www.tradingview.com/chart/CHFPLN/SdzgiPqF-CHFPLN-Action-Plan
-
HEATING OIL Buy Signal
- November 6, 2019
- Posted by: Tradingshot Articles
- Category: Uncategorized
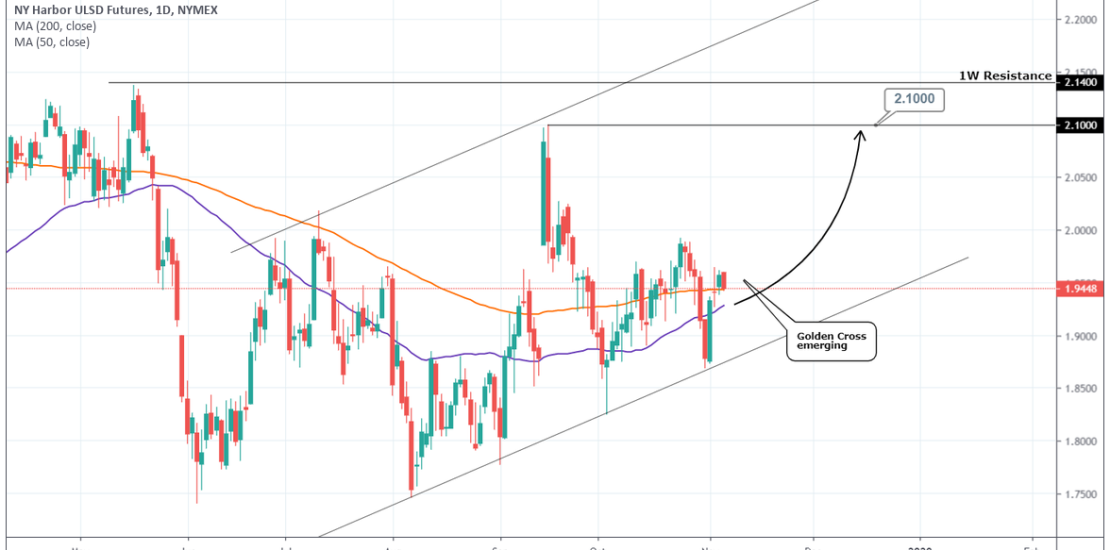
Pattern: 1W Channel Up. Signal: Bullish as the pattern made a Higher Low. Target: 2.1000. Tradingview link: https://www.tradingview.com/chart/HO1!/YBG5Xkue-HEATING-OIL-Buy-Signal