

-
XTZUSD Buy Signal
- October 17, 2019
- Posted by: Tradingshot Articles
- Category: Uncategorized
No Comments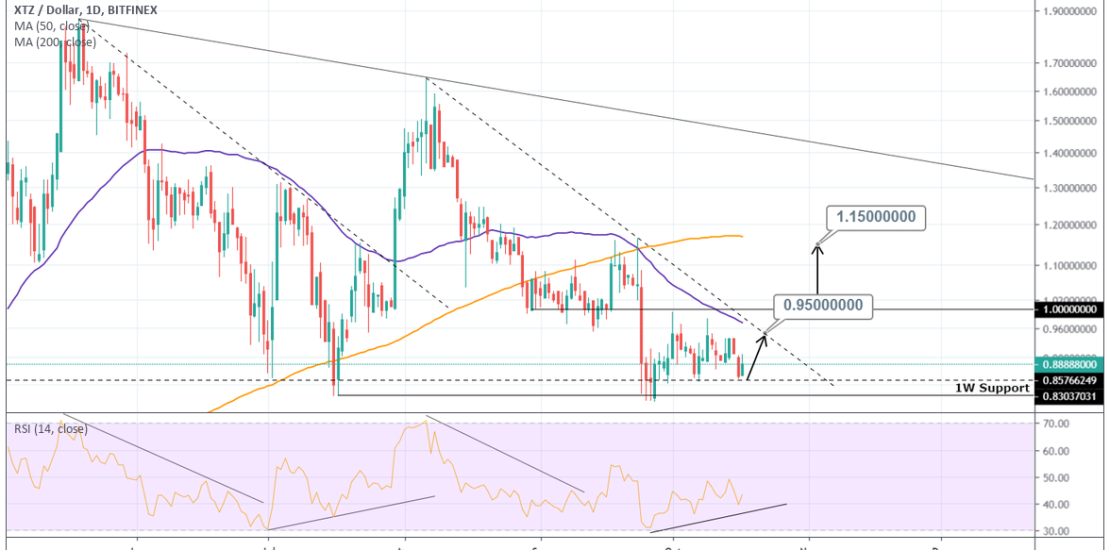
Pattern: 1W Descending Triangle. Signal: Bullish as the price is bouncing on the Support. Target: 0.9500 and if 1.0000 breaks extension to 1.1500 possible. Tradingview link: https://www.tradingview.com/chart/XTZUSD/YHFqwKzG-XTZUSD-Buy-Signal
-
ALTCOIN MARKET RSI Bullish divergence aiming initially at 81B
- October 15, 2019
- Posted by: Tradingshot Articles
- Category: Uncategorized
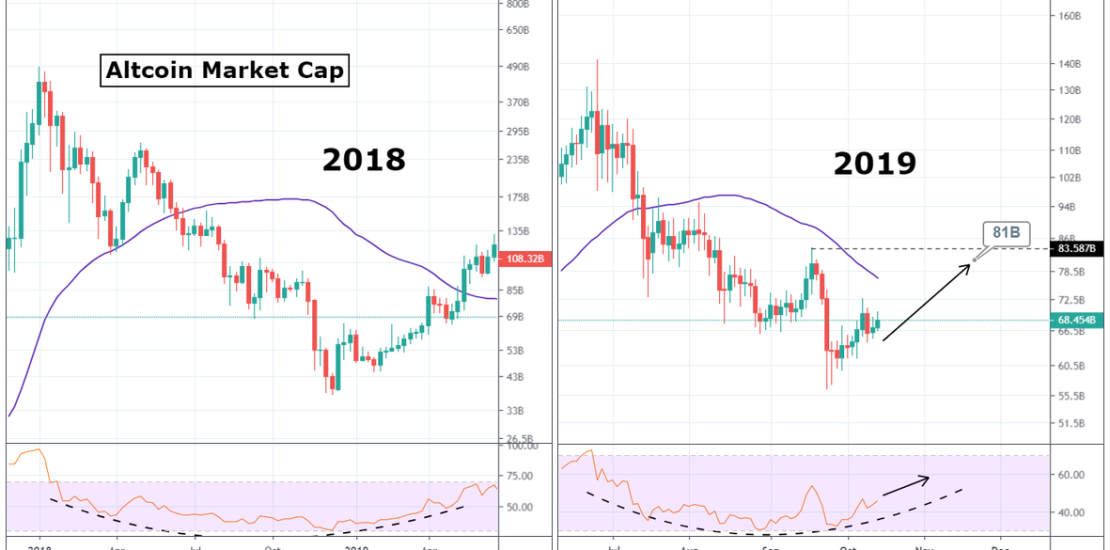
I am comparing the 2018 Alt Market Cap on 1W with the current (June 2019 – date) on 2D. There are some obvious similarities with the most significant of all the bullish divergence on the RSI. The MA50 is also on the same pattern while the candle action is nearly identical. Because of this I
-
TRXUSD Is it repeating this pattern?
- October 14, 2019
- Posted by: Tradingshot Articles
- Category: Uncategorized
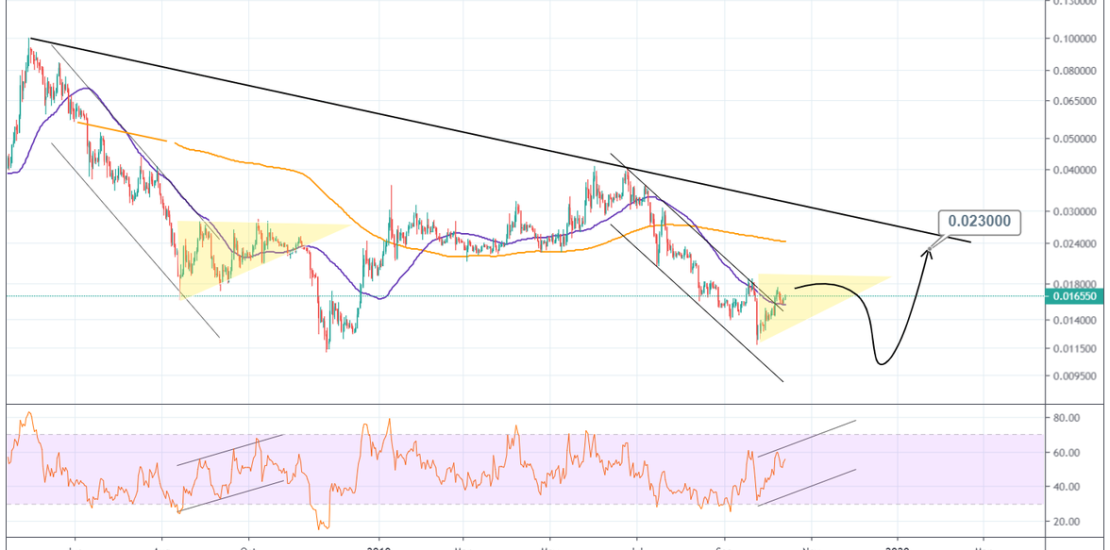
Based on the RSI divergence and how the 1D MA50 and MA200 are trading, then yes it is possible that TRON is repeating the August – November 2018 sequence. The current Triangle is completed with one last dip towards 0.01000, which will be the opportunity for buyers to step in. Moderate Target: 0.023000. Tradingview link:
-
GBPSEK Buy Signal
- October 7, 2019
- Posted by: Tradingshot Articles
- Category: Uncategorized
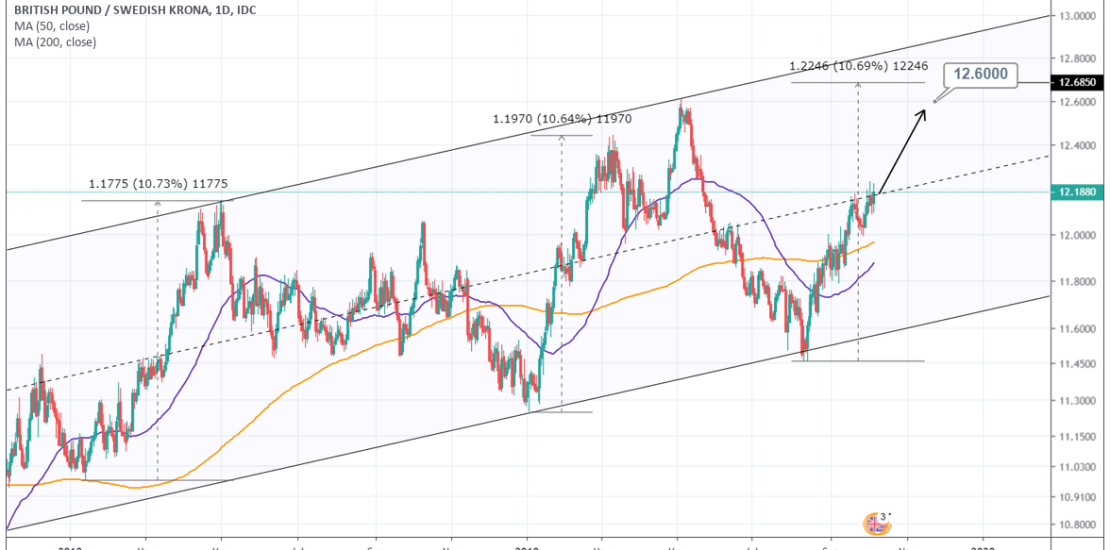
Pattern: 1M Channel Up. Signal: Bullish since it broke the middle of the Channel after a rebound on the Higher Low. Tradingview link: https://www.tradingview.com/chart/GBPSEK/tZaz7eUY-GBPSEK-Buy-Signal
-
WTI OIL Buy Signal
- October 6, 2019
- Posted by: Tradingshot Articles
- Category: Uncategorized
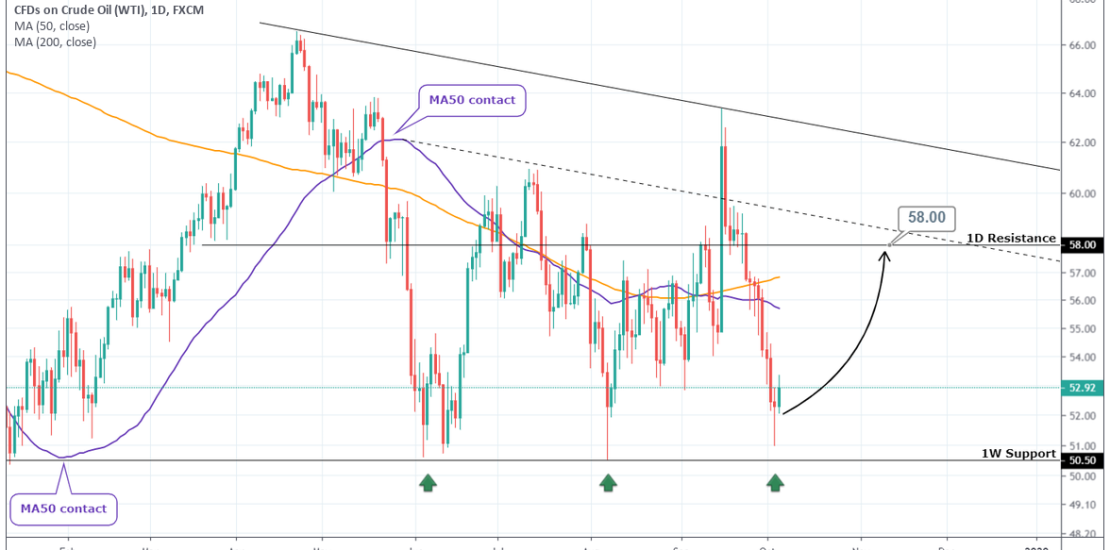
Pattern: 1W Descending Triangle. Signal: Bullish as the price rebounded on the 1W Support. Target: 58.00 (Lower High zone of the Descending Triangle). Tradingview link: https://www.tradingview.com/chart/USOIL/ZQUfDDVU-WTI-OIL-Buy-Signal
-
GOLD Medium term consolidation. Make profit both ways.
- October 3, 2019
- Posted by: Tradingshot Articles
- Category: Uncategorized
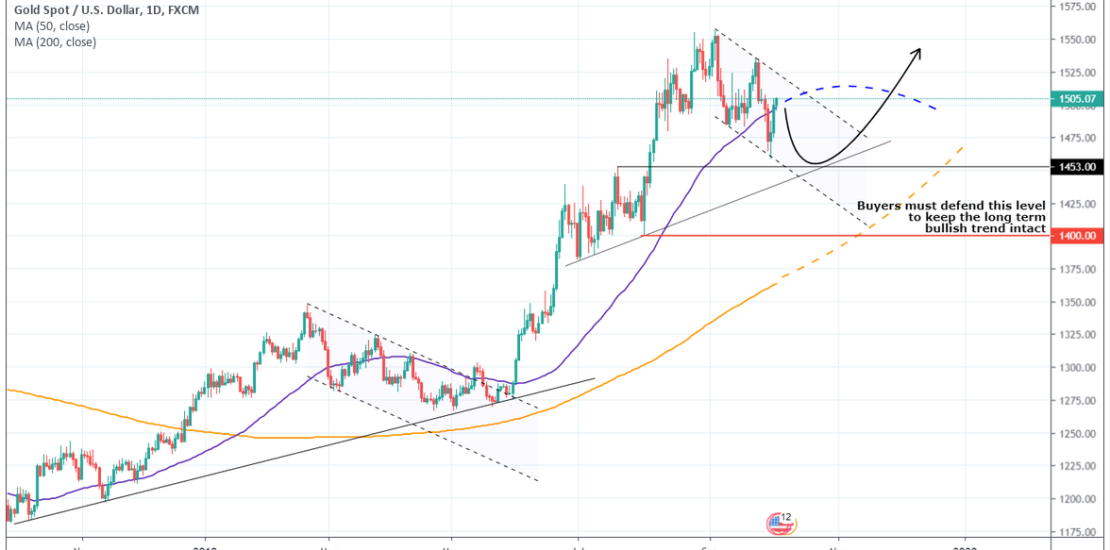
Pattern: Channel Down on 1D. Signal: Bearish as it is approaching the Lower High of the Channel. Target: 1453 (former High). Tradingview link: https://www.tradingview.com/chart/XAUUSD/YlpWlPT4-GOLD-Medium-term-consolidation-Make-profit-both-ways
-
ETH DOMINANCE Bullish Divergence
- October 2, 2019
- Posted by: Tradingshot Articles
- Category: Uncategorized
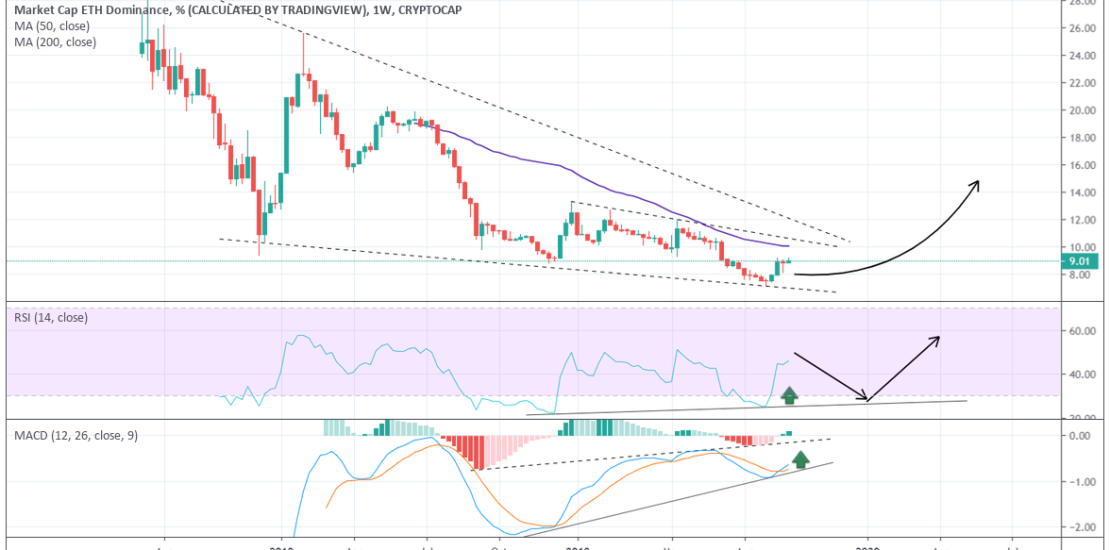
With Ethereum approaching again the 1W MA50 on the dominance chart, I thought it would be a could time to look at its key indicators, RSI and MACD. Both show a Bullish Divergence despite trading on a Falling Wedge printing Lower Lows. Do you agree with this chart? Tradingview link: https://www.tradingview.com/chart/ETH.D/CuqVVzOI-ETH-DOMINANCE-Bullish-Divergence
-
AUDZAR Sell Signal
- October 2, 2019
- Posted by: Tradingshot Articles
- Category: Uncategorized
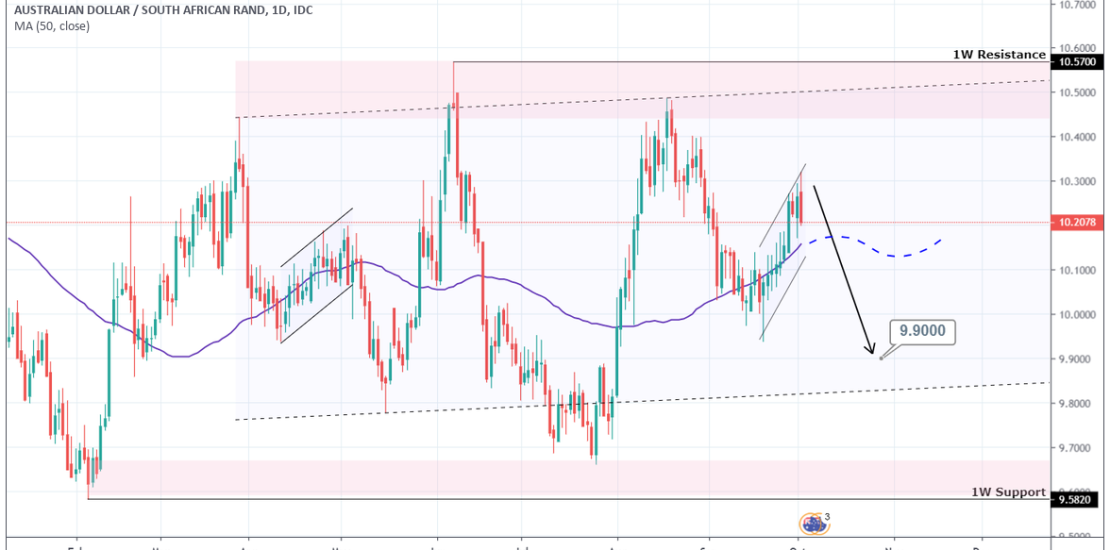
Pattern: 1W Rectangle (9.5820 Support – 10.5700 Resistance). Signal: Bearish as the price completed a cyclical Lower High within the pattern. Target: 9.9000. Tradingview link: https://www.tradingview.com/chart/AUDZAR/K2MenvgT-AUDZAR-Sell-Signal
-
EURUSD Buy Signal
- September 25, 2019
- Posted by: Tradingshot Articles
- Category: Uncategorized
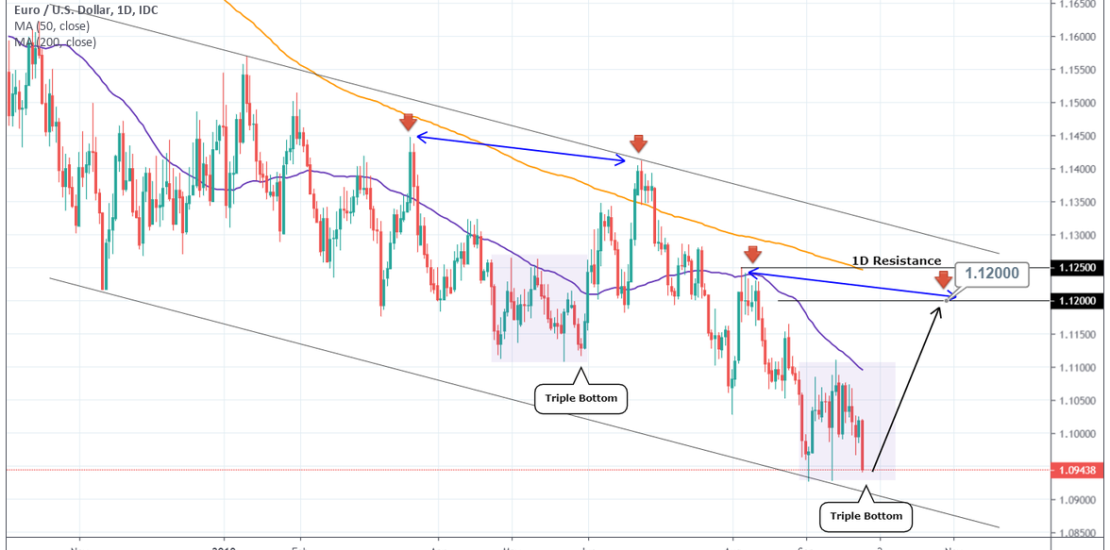
Pattern: 1W Channel Down. Signal: Bullish due to A) the Lower Low of the Channel Down and B) almost Triple Bottom as the April – May cohesion. Target: 1.12000 (symmetrical point within the 1D Resistance Zone). Tradingview link: https://www.tradingview.com/chart/EURUSD/tABCNe61-EURUSD-Buy-Signal
-
GBPJPY Lower Buy Signal
- September 19, 2019
- Posted by: Tradingshot Articles
- Category: Uncategorized
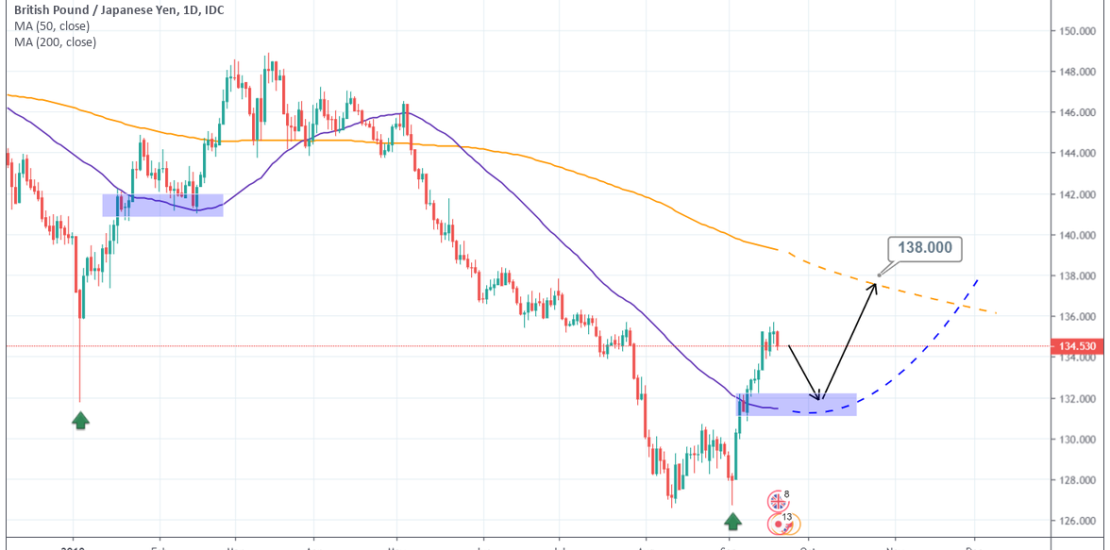
Pattern: 4H Channel Up. Signal: Bullish once a pull back takes place towards the 1D MA50 in the same fashion as Jan/ Feb 2019. Target: 138.000 (expected contact with the 1D MA200). Tradingview link: https://www.tradingview.com/chart/GBPJPY/Lcrq45u0-GBPJPY-Lower-Buy-Signal