- March 23, 2020
- Posted by: Tradingshot Articles
- Category: Uncategorized

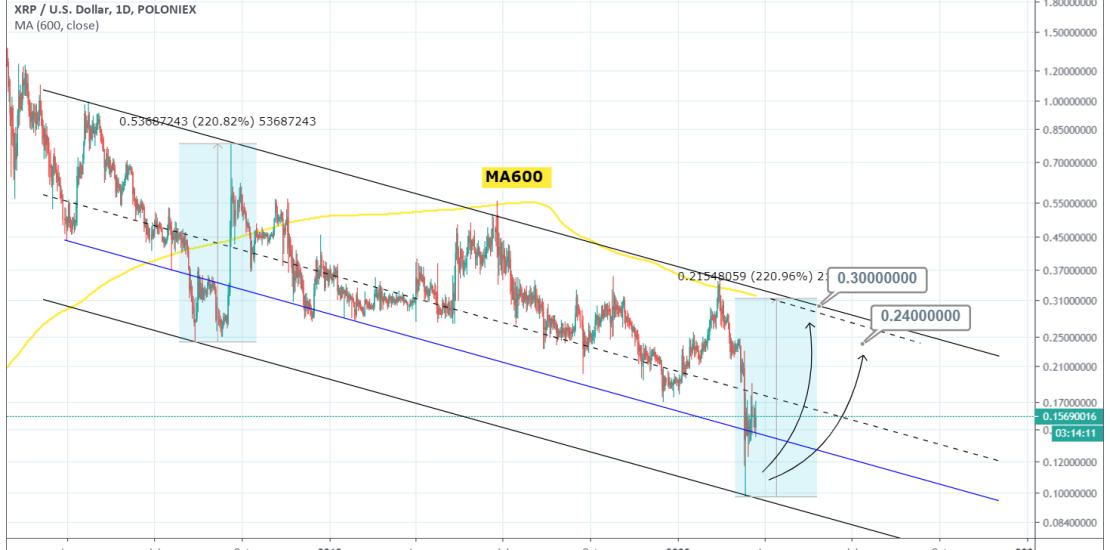
Going way back in mid 2018 the pattern is a Channel Down. For most of the pattern’s lifetime the price has been trading above the median with a level just below (blue line) working as the Support. That is except for two occasions where a Lower Low was made: August 2018 and recently March 2020.
There are two scenarios for XRPUSD right now: Either (A) a +220% Lower High rise as in 2018 to $0.30 or (B) a slower rise to a Lower High at $0.24 assuming the March heavy sell-off was an anomaly caused by the coronavirus panic.
Notice also how the last two Lower Highs were rejected exactly on the 1D MA600. This means that we need a sustainable break above this trend line to start considering a Bull Market on Ripple.
Tradingview link:
https://www.tradingview.com/chart/XRPUSD/4mnlZkvL-XRPUSD-Two-good-case-scenarios-0-24-and-0-30

