

- February 21, 2019
- Posted by: Tradingshot Articles
- Category: Cryptocurrency
No Comments
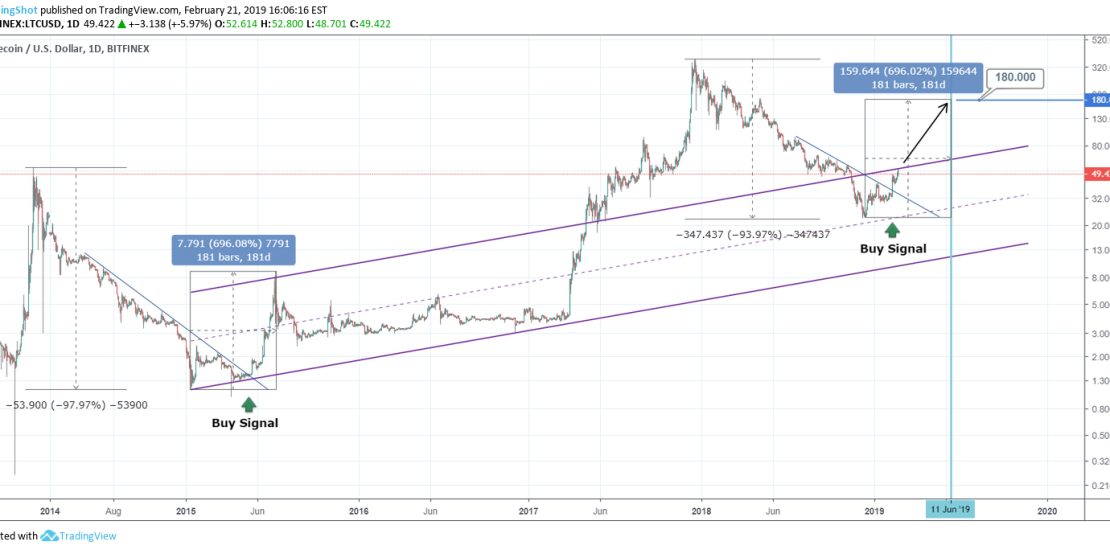
I feel that the chart is clear enough to explain the idea behind it.
Litecoin’s two bear markets (2014-2015 and 2018-2019) share a similar pattern behavior. A Buy Signal occurred in May 2015 after the bottom was made in January and a support was formed. The price broke a Lower High trend line and rallied nearly +700%. The duration from the bottom to the rally’s high was 181 days.
The very same Buy Signal has emerged this February (2019). It is again after December’s 2018 bottom and again broke the Lower High trend line.
Can this be a call for a +700% rally to 180.00? This chart certainly shows is can be.
Tradingview link: