-
BITCOIN will extend the rally based on the alts market cap!
- May 19, 2023
- Posted by: Tradingshot Articles
- Category: Cryptocurrency
No Comments
Bitcoin (BTCUSD) has been on a 1 month pull-back ever since it started the new Bull Cycle rally at the start of this year. We have compared the current Cycle to that of 2015-2017 numerous times and as the market fears (yet again) of a stronger correction/ major trend reversal, the Crypto Total Altcoin Market
-
BITCOIN 1W Ichimoku turns green = final BUY SIGNAL!!
- May 18, 2023
- Posted by: Tradingshot Articles
- Category: Cryptocurrency
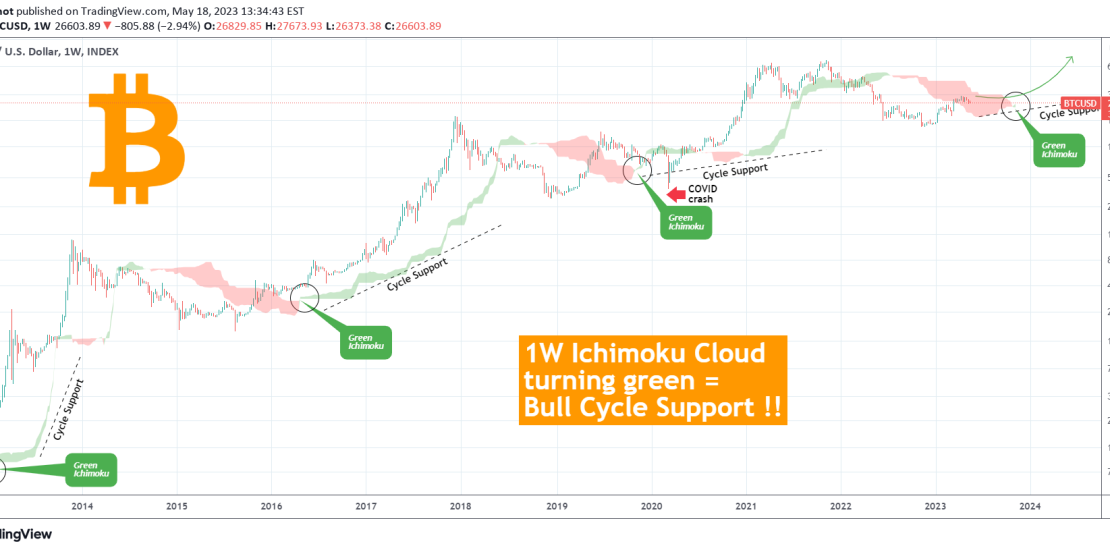
Bitcoin (BTCUSD) turned its Ichimoku Cloud green again on the 1W time-frame for the first time since July 2022. However it is the first time that it goes from red to green since December 2020 and if it wasn’t for the March 2020 COVID crash, it would have been the first since November 2019! This
-
BITCOIN Is approaching its bottom. Will you buy this?
- May 17, 2023
- Posted by: Tradingshot Articles
- Category: Cryptocurrency
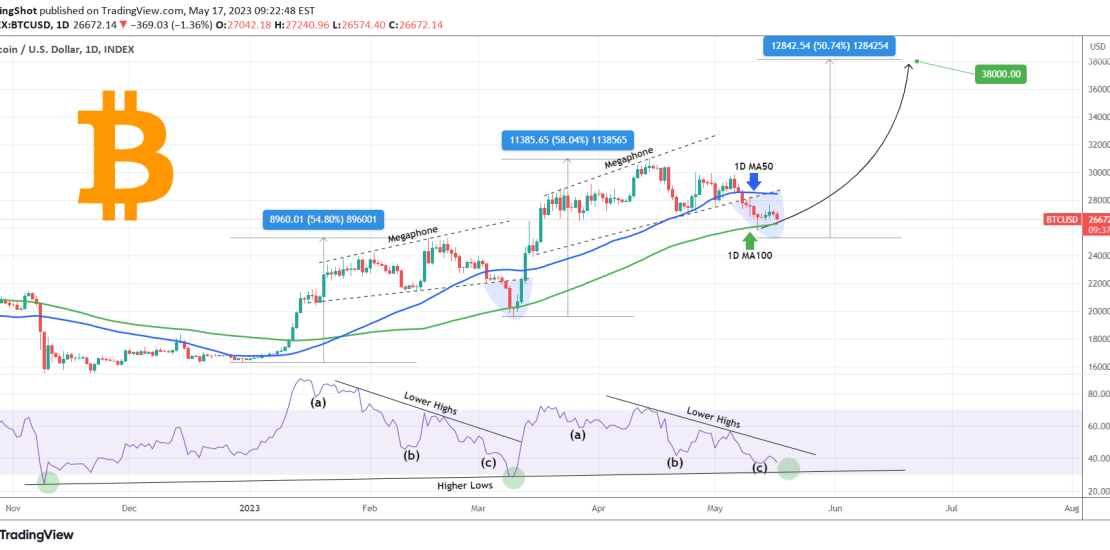
Bitcoin (BTCUSD) is trading again back towards its 1D MA100 (green trend-line) after rebounding on it a few days ago. This is a minor bearish signal on the short-term as the previous hit and pump on the 1D MA100 (March 09) delivered a massive rebound instantly. The 1D RSI however shows that the bottom is
-
BITCOIN hit the 1W MA200 after 2 months! Stocks may show the way
- May 12, 2023
- Posted by: Tradingshot Articles
- Category: Cryptocurrency
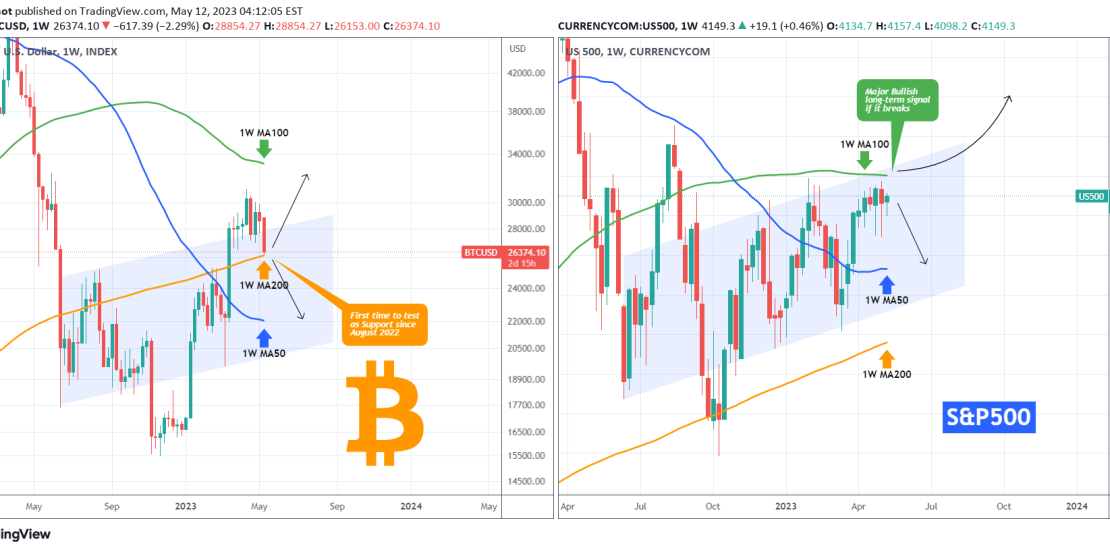
Bitcoin (BTCUSD) hit today the 1W MA200 (orange trend-line) for the first time since the March 13 weekly bullish break-out. Basically this is the first time that the 1W MA200 is being tested as a Support since the weekly candle of August 15 2022. If it holds, it will be confirmed most likely as a
-
TOMIUSD Buy the pull-back on full display
- May 12, 2023
- Posted by: Tradingshot Articles
- Category: Cryptocurrency
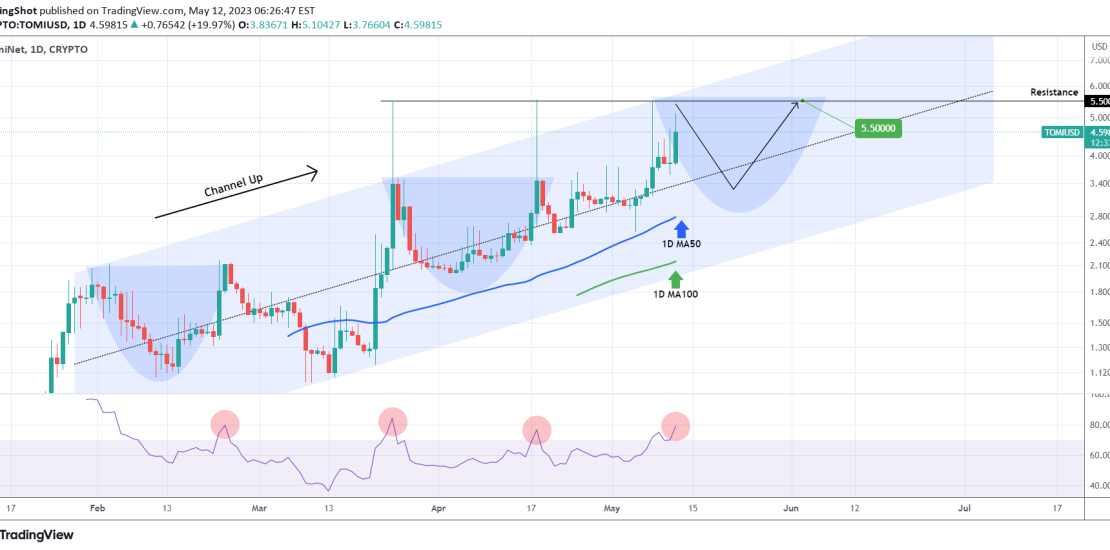
TomiNet (TOMIUSD) is trading within a Channel Up pattern since the start of February and right now has almost done a Double Top on the Higher Highs trend-line. On the previous two occasions this has resulted in a pull-back marginally below the Channel’s middle (dotted trend-line). As long as the 1D MA50 (blue trend-line) is
-
BITCOIN A 2020 fractal calls for 25/26k before a strong rally!
- May 11, 2023
- Posted by: Tradingshot Articles
- Category: Cryptocurrency
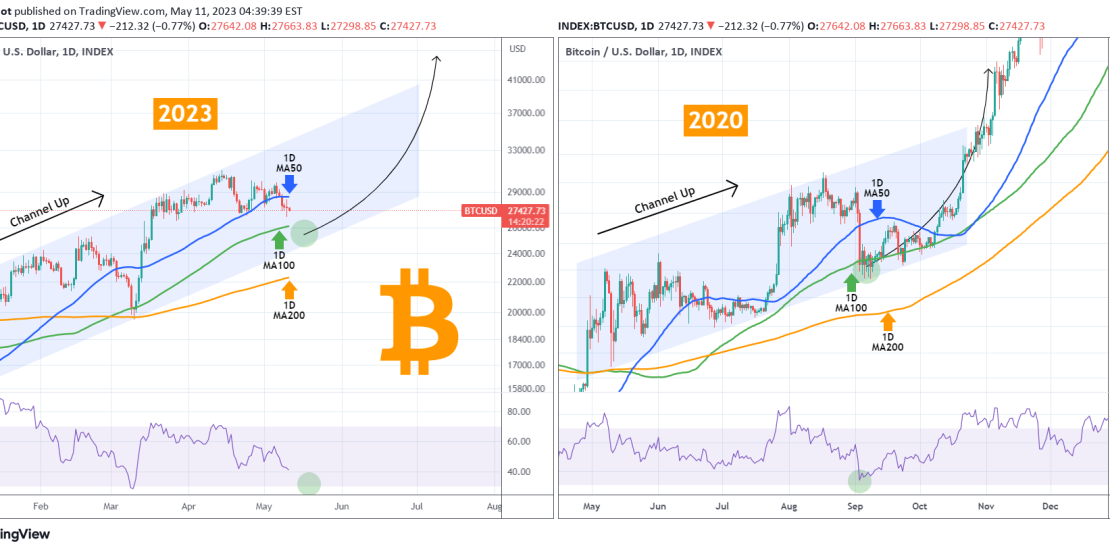
Bitcoin (BTCUSD) has been trading below the 1D MA50 (blue trend-line) for the 4th straight day, inside this 4 month Channel Up. We have spotted a similar Channel Up pattern from May to October 2020. This started a rally after two conditions were met: the 1D RSI hit 35.00 and the price broke below the
-
STXUSD near the bottom of its Rising Wedge.
- May 10, 2023
- Posted by: Tradingshot Articles
- Category: Cryptocurrency
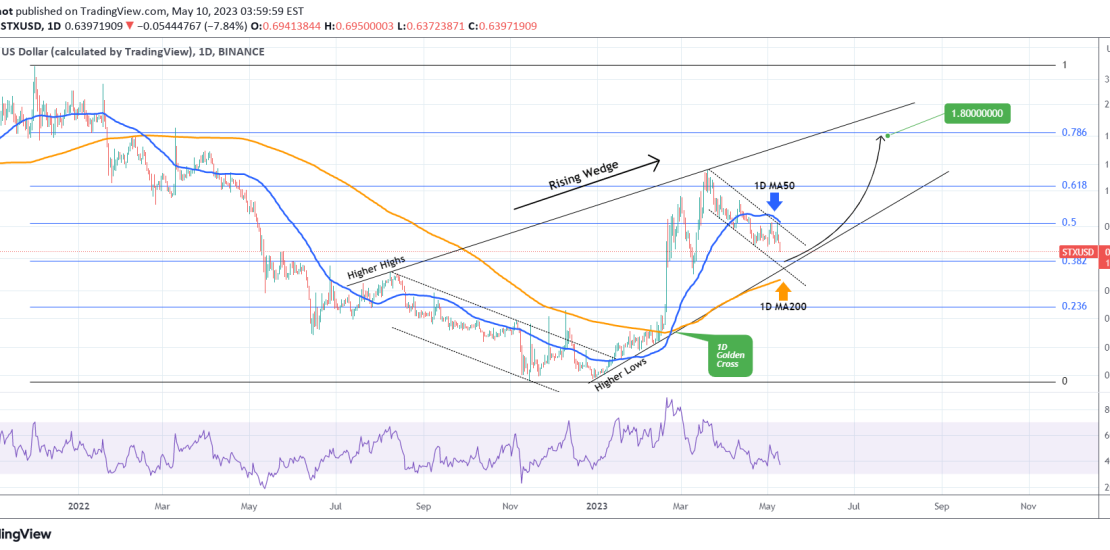
Stacks (STXUSD) had a Double Top rejection this week on its 1D MA50 (blue trend-line) and is approaching the bottom of the long-term Rising Wedge pattern. With the presence also of the 0.382 Fibonacci, this is the strongest buy signal since February 15. The 1D MA200 (orange trend-line) is right below it and the 1D
-
RIFUSD Trade the Triangle’s break-out
- May 8, 2023
- Posted by: Tradingshot Articles
- Category: Cryptocurrency
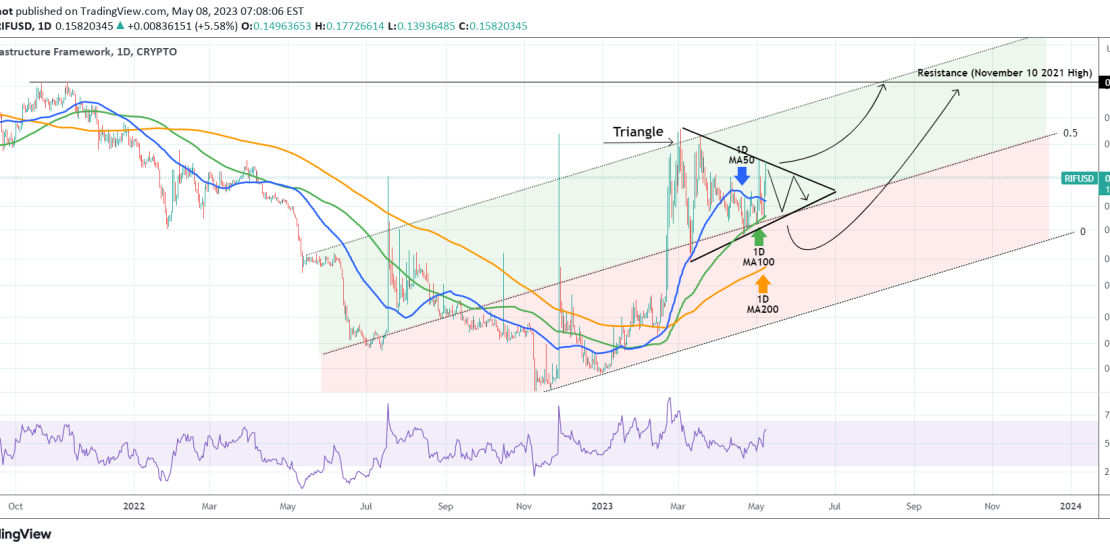
The RSK Infrastructure Framework (RIFUSD) is trading on a Triangle pattern within a long-term Channel Up. The strong Support is the 1D MA100 (green trend-line), holding since mid January. A 1D candle closing above the top of the Triangle would be a bullish signal, targeting the 0.30900 Resistance (November 10 2021 High). Similarly a closing
-
BITCOIN next Top can be at least $200k!
- May 8, 2023
- Posted by: Tradingshot Articles
- Category: Cryptocurrency
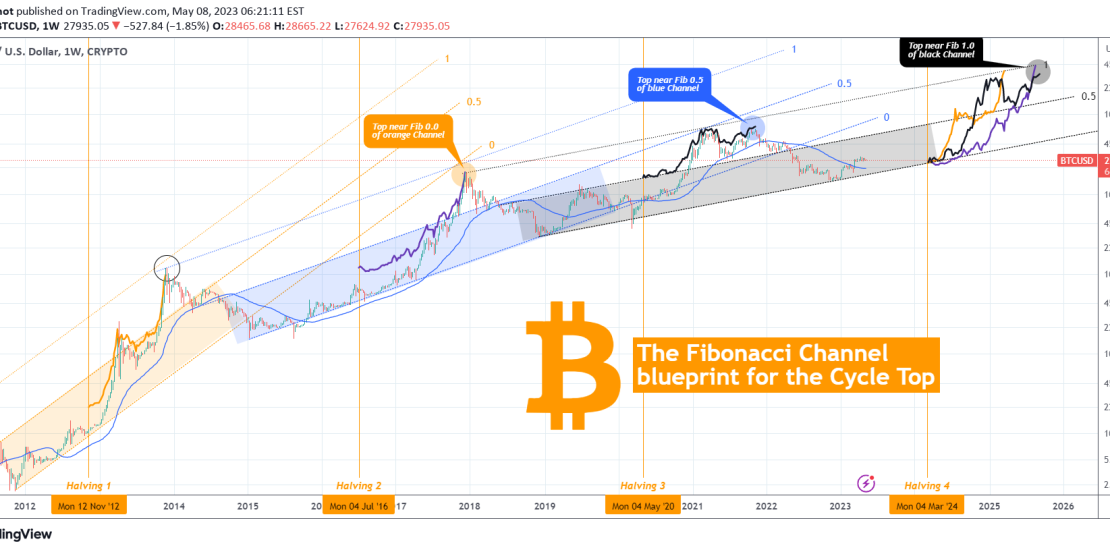
Bitcoin (BTCUSD) is on a short-term pull-back and much of the crypto community casts doubts again over the recent rally and if this is indeed a new Bull Cycle or a bear market counter trend rally. In times of short-term uncertainty we tend to rely our channel on the long-term time-frames and for BTC in
-
BITCOIN When you see this, it will already be TOO LATE!
- May 4, 2023
- Posted by: Tradingshot Articles
- Category: Cryptocurrency
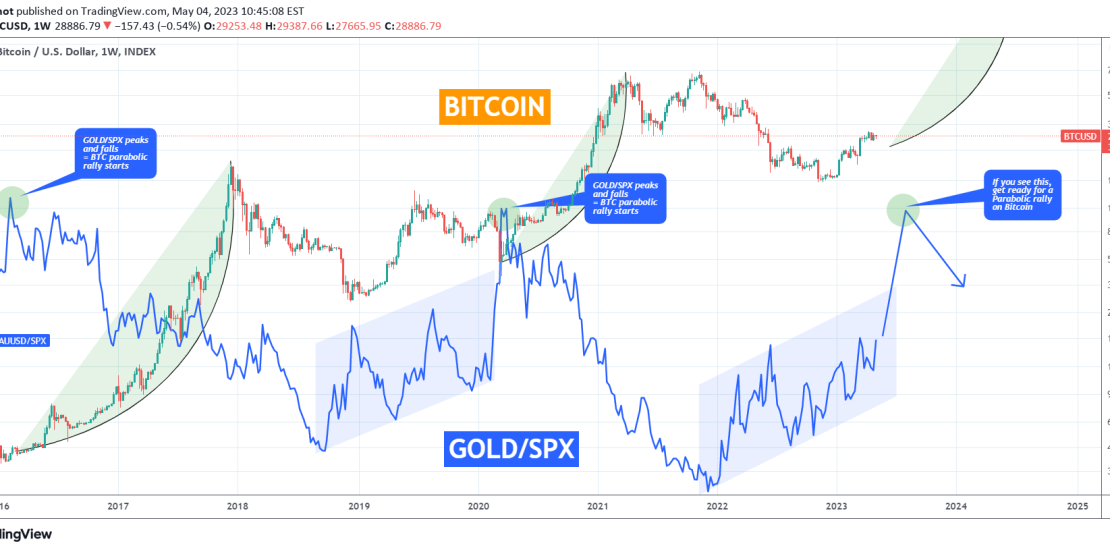
This is an interesting analysis on the 1W time-frame of Bitcoin (BTCUSD) against the GOLD/SPX ratio(blue trend-line). The conclusion that this comparison offers can be very valuable. As you see, when the GOLD/SPX ratio peaks and starts pulling back, Bitcoin starts the Parabolic Rally of its Bull Cycle. At the moment the GOLD/SPX ratio is

