

- May 12, 2023
- Posted by: Tradingshot Articles
- Category: Cryptocurrency
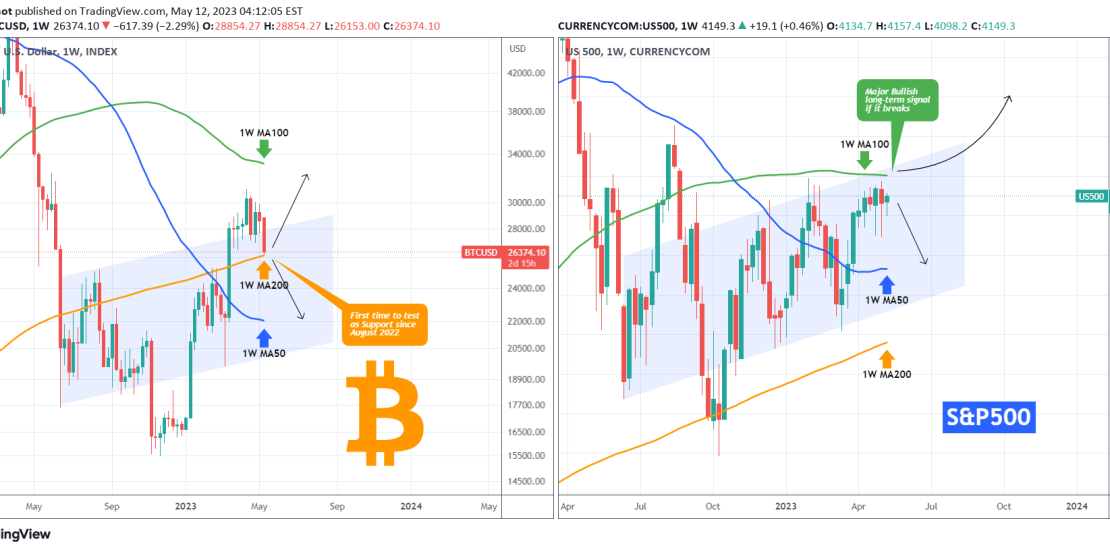
Bitcoin (BTCUSD) hit today the 1W MA200 (orange trend-line) for the first time since the March 13 weekly bullish break-out. Basically this is the first time that the 1W MA200 is being tested as a Support since the weekly candle of August 15 2022. If it holds, it will be confirmed most likely as a Support and accumulate more buyers for a rebound to the last standing MA level, the 1W MA100 (green trend-line). If it closes below the 1W MA200, we may see a final pull-back to the 1W MA50 (blue trend-line).
The stock market (right chart) represented by the S&P500 (SPX) on this analysis, may be an early signal to BTC’s price action as it is near its own 1W MA100 (green trend-line), for 5 straight weeks. If broken, it will be a major long-term buy signal as it has been untouched since the week of August 22 2022. The longer it fails to break it, the more probable it is to make one last pull-back to its 1W MA50 (blue trend-line).
So what do you think? Will BTC hold its 1W MA200 and if so, coupled with an S&P500 break-out above its 1W MA100, will it reach $32000? Feel free to let us know in the comments section below!
Tradingview link: