- May 8, 2023
- Posted by: Tradingshot Articles
- Category: Cryptocurrency

Bitcoin (BTCUSD) is on a short-term pull-back and much of the crypto community casts doubts again over the recent rally and if this is indeed a new Bull Cycle or a bear market counter trend rally.
In times of short-term uncertainty we tend to rely our channel on the long-term time-frames and for BTC in particular its historic Cycles. Those are patterns that have repeated themselves over and over again, with some variations of course based on the current market conditions.
** The Fibonacci Channels **
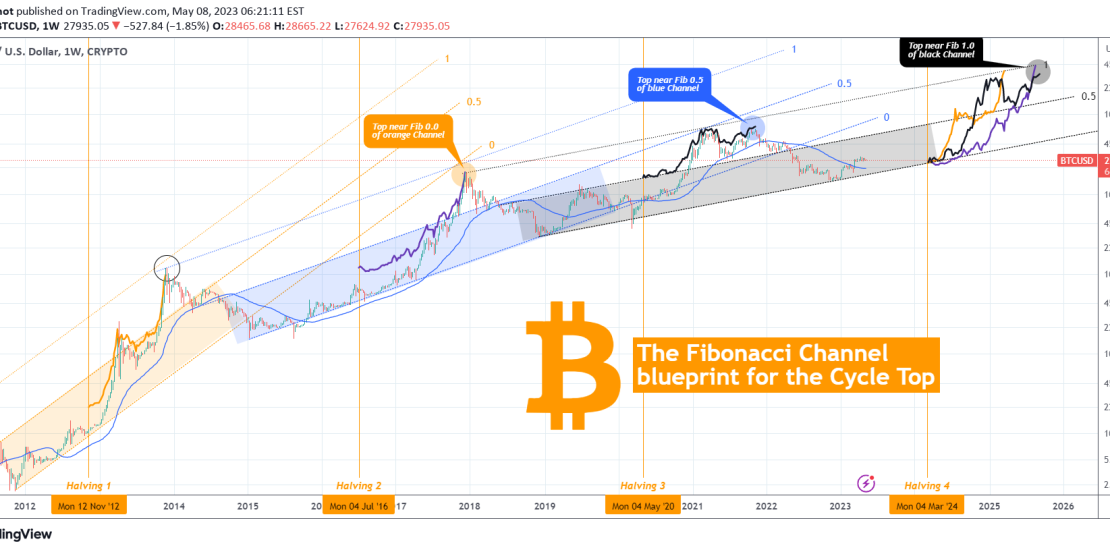
Right now the price is above the 1W MA50 (blue trend-line), on a 5-month rally that hasn’t been anything like short-term Bear Cycle rallies. The previous Cycles topped near Fibonacci trend-lines of prior Cycle Channels. For example the December 2017 Cycle Top was formed just below the bottom (Fib 0.0) of the orange Fibonacci Channel that started from the previous Cycle bottom. The November 2021 Top was formed just below the middle (Fib 0.5) of the blue Fibonacci Channel. This could be a +0.5 Fib progression and in that case the Top of the current Cycle might be just below the top (Fib 1.0) of the black Fibonacci Channel that started on the December 2018 bottom.
** The Halvings and $200k **
The 1.0 Fib at the time of (the next) Halving 4 (March 2024) will be above $200000, and as we know after each Halving, Bitcoin posts the most aggressive (parabolic) rally of the Bull Cycle. So that leads us to assume that the Top of the current Bull Cycle will be at least $200k. To give a relative sense of pathing, we have plotted the ‘post Halving rallies’ of the previous three Cycles on the current Channel starting on Halving 4.
Do you think that we will see $200k by 2025 Q3? Feel free to let us know in the comments section below!
Tradingview link:
https://www.tradingview.com/chart/BTCUSD/4NfpXTUz-BITCOIN-next-Top-can-be-at-least-200k

