
-
GOLD forming a symmetrical November bullish break-out pattern.
- January 11, 2022
- Posted by: Tradingshot Articles
- Category: Commodities
No Comments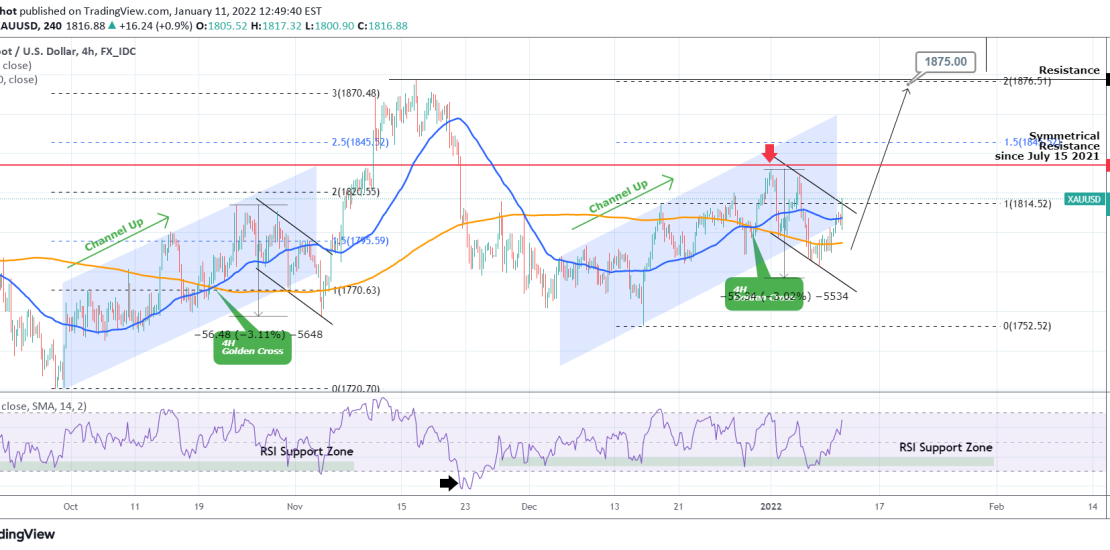
As you see Gold spot prices (XAUUSD) broke below their dominant Channel Up pattern of December but this didn’t turn out to be a bearish signal as the very same bullish (break-out) flag was formed in October’s Channel Up. The Bull Flag (black channel) eventually recovered the 4H MA50 (blue trend-line) and broke upwards,
-
WTI OIL is on track for the October $85.00 high
- January 11, 2022
- Posted by: Tradingshot Articles
- Category: Commodities
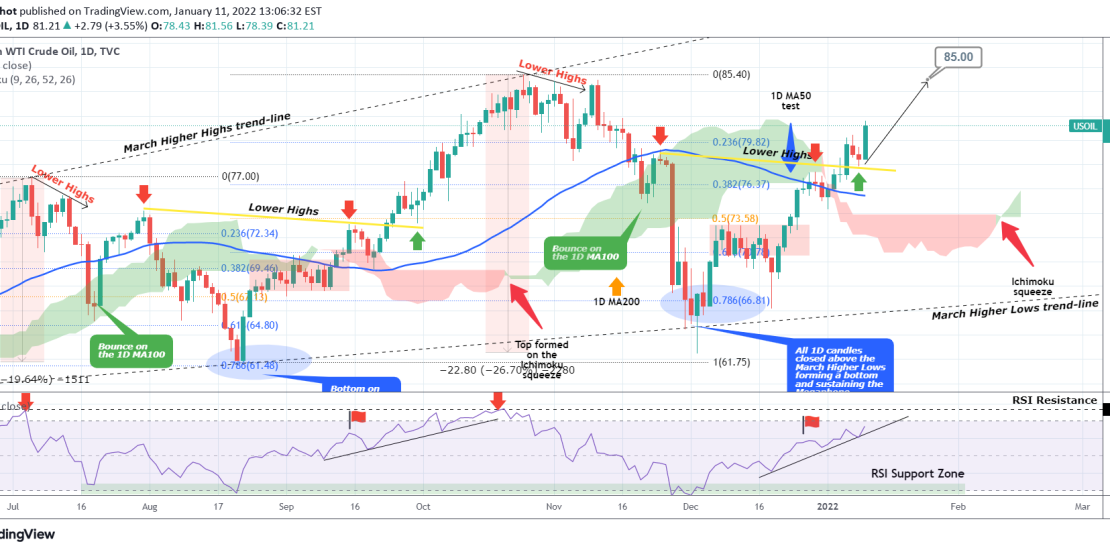
We have been following this bullish sequence on WTI Oil closely since the December 02 2021 bottom and so far is following our projection to a great extent: As you see, the most recent pull-back (red arrow) was successfully made on the yellow Lower Highs trend-line and after the price recovered, it re-tested
-
WTI OIL The important 1D MA50 test
- December 27, 2021
- Posted by: Tradingshot Articles
- Category: Commodities
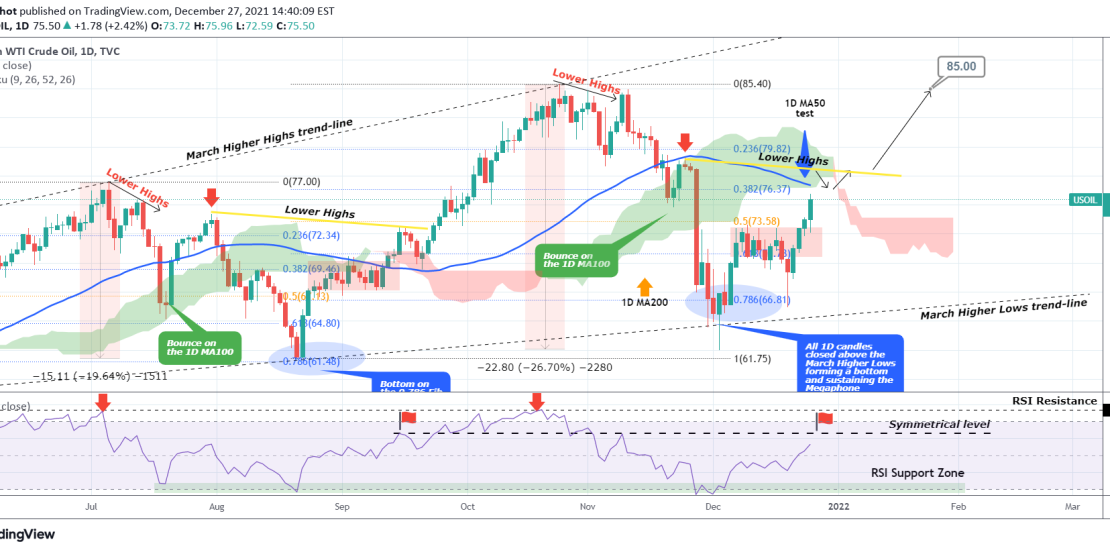
Right now WTI is ahead of the first important test of this uptrend, the 1D MA50 (blue trend-line) which is currently posing as a Resistance. If that breaks, we have a strong case of a bullish continuation. However, this the current wave is repeating that of August – September quite closely, the (yellow) Lower
-
WTI OIL Consolidation almost over. Buy the break-out.
- December 16, 2021
- Posted by: Tradingshot Articles
- Category: Commodities
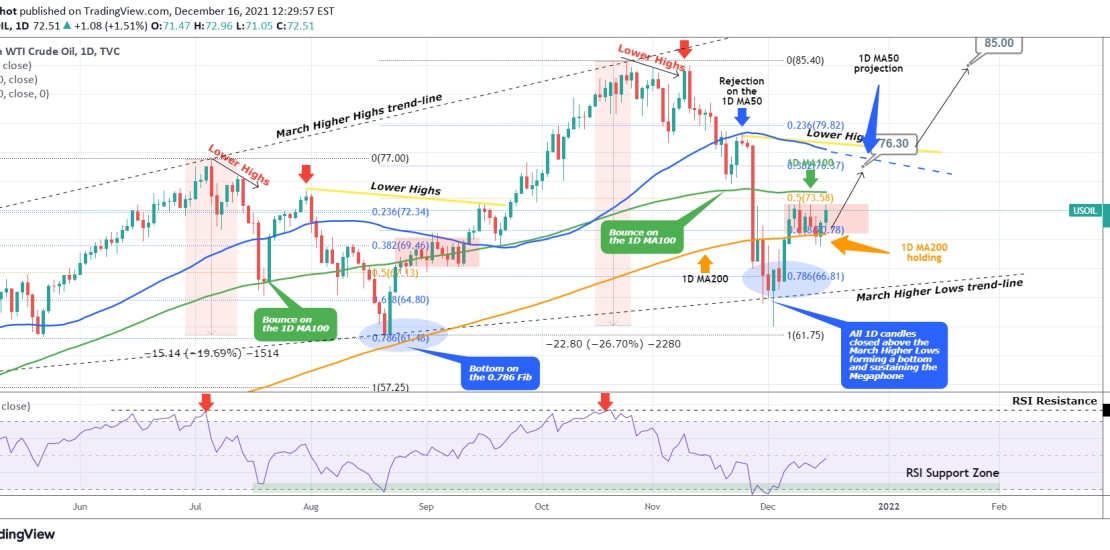
This is an update to a pattern on WTI that I’ve been working on since August: As you see, the price did eventually rebound and right now is consolidating within the 1D MA200 (orange trend-line) being the Support and the 1D MA100 (green trend-line) being the Resistance. This is similar to the August 25
-
WTI OIL approaching a medium-term Resistance
- December 8, 2021
- Posted by: Tradingshot Articles
- Category: Commodities
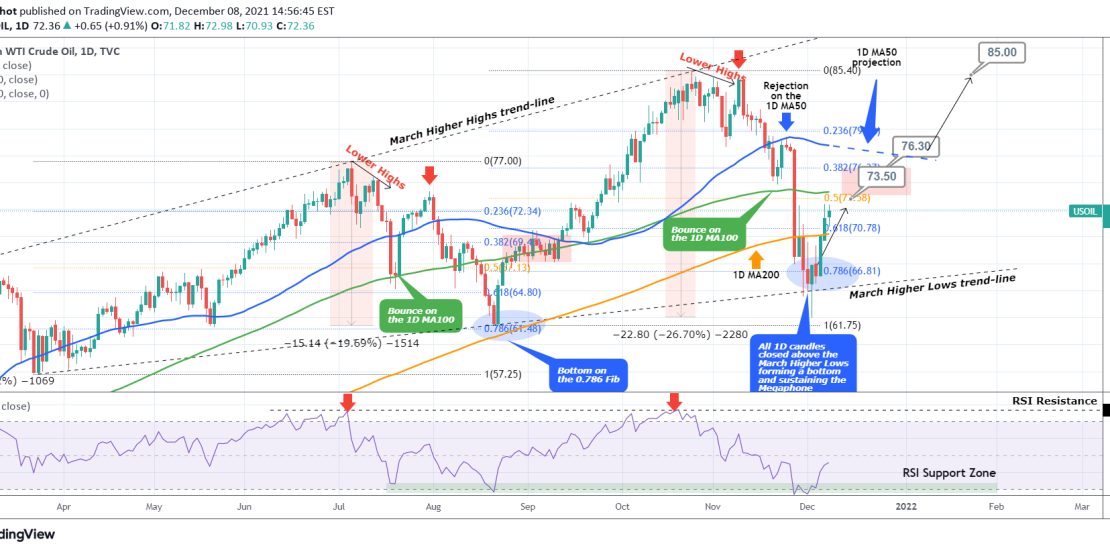
This is an update to my WTI Oil outlook made over a week ago: Despite breaking below the 0.786 Fibonacci retracement level and the Higher Lows trend-line of the multi-month Bullish Megaphone pattern, the price managed to close all 1D candles within the pattern and formed a Support. It has come very close to
-
WTI OIL Ideal long-term buy opportunity
- November 30, 2021
- Posted by: Tradingshot Articles
- Category: Commodities
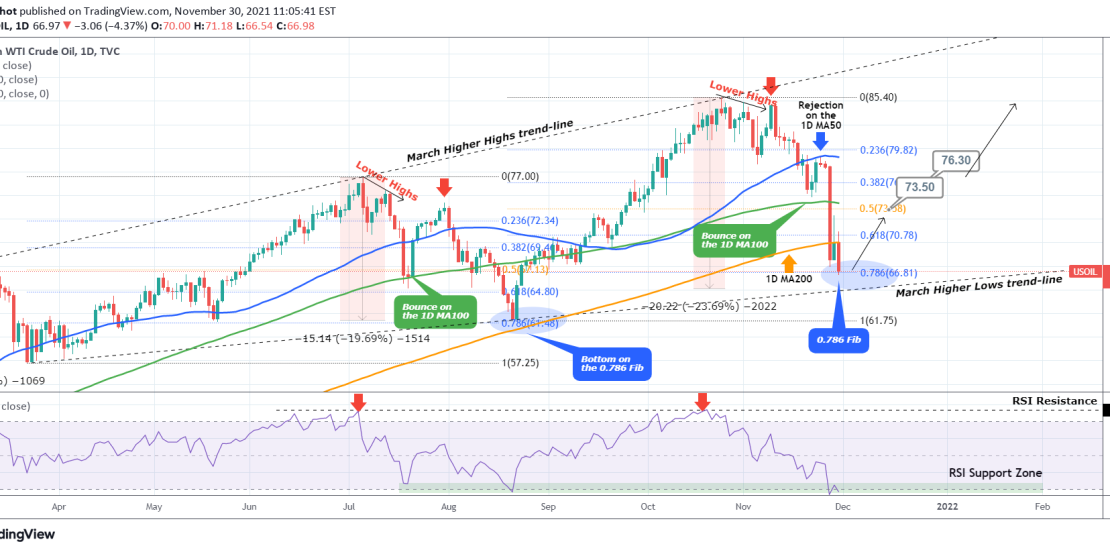
WTI Oil is down more than -20% since the October High. The fundamentals over the new Omicron COVID variant have undoubtedly accelerated this but technically this is a much needed correction following the big rally of August – October. My last update on WTI was the following, where I pointed out the upcoming rejection
-
WTI OIL Rejection on the 1D MA50
- November 25, 2021
- Posted by: Tradingshot Articles
- Category: Commodities
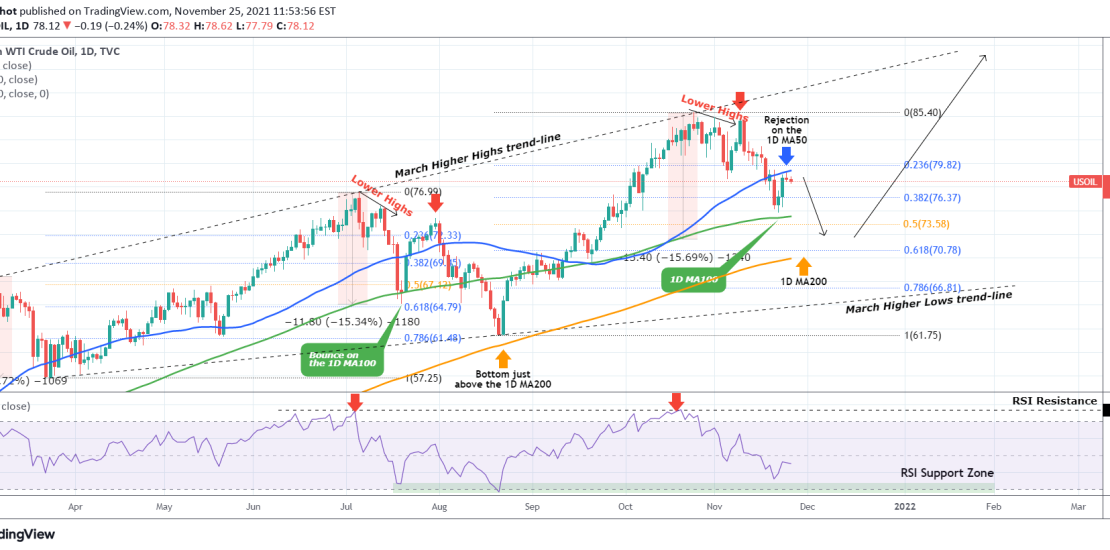
Pattern: Megaphone on the 1D time-frame. Signal: Sell as the price has been rejected on the 1D MA50 (blue trend-line) and buy before it touches the 1D MA200 (orange trend-line) or when the RSI hits the Support Zone. Target: 85.40 (the October 23 High). Tradingview link: https://www.tradingview.com/chart/USOIL/Ruv1Y4G2-WTI-OIL-Rejection-on-the-1D-MA50
-
COPPER Buy signal
- November 24, 2021
- Posted by: Tradingshot Articles
- Category: Commodities
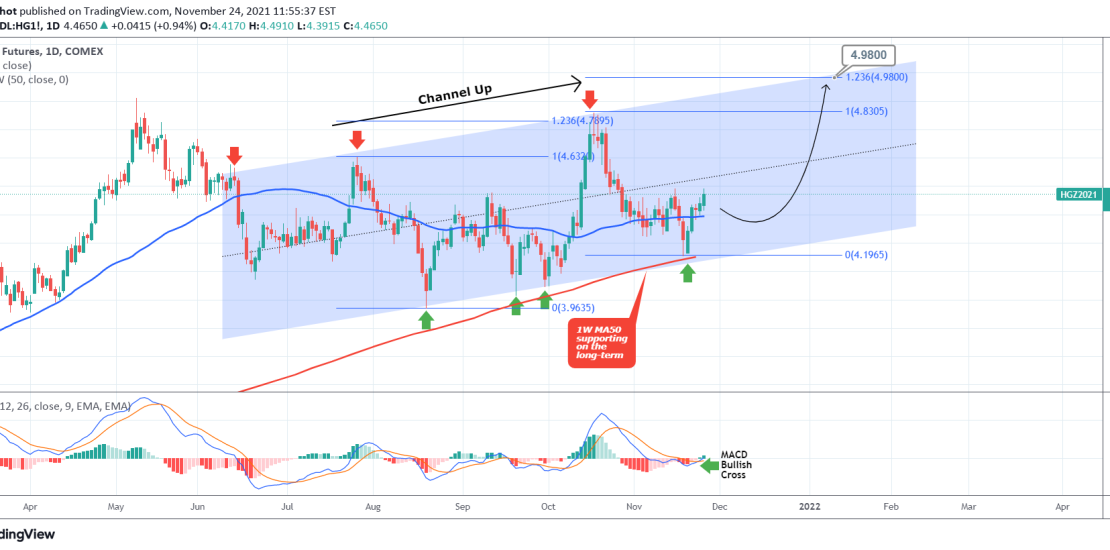
Pattern: Channel Up on 1D. Signal: Buy as the price is rebounding on the Higher Lows (bottom) trend-line of the Channel Up while the MACD just formed a Bullish Cross. Target: 4.980 (the 1.236 Fibonacci extension). Tradingview link: https://www.tradingview.com/chart/HG1!/9bWfnHKZ-COPPER-Buy-signal
-
PLATINUM targeting $1090
- November 24, 2021
- Posted by: Tradingshot Articles
- Category: Commodities
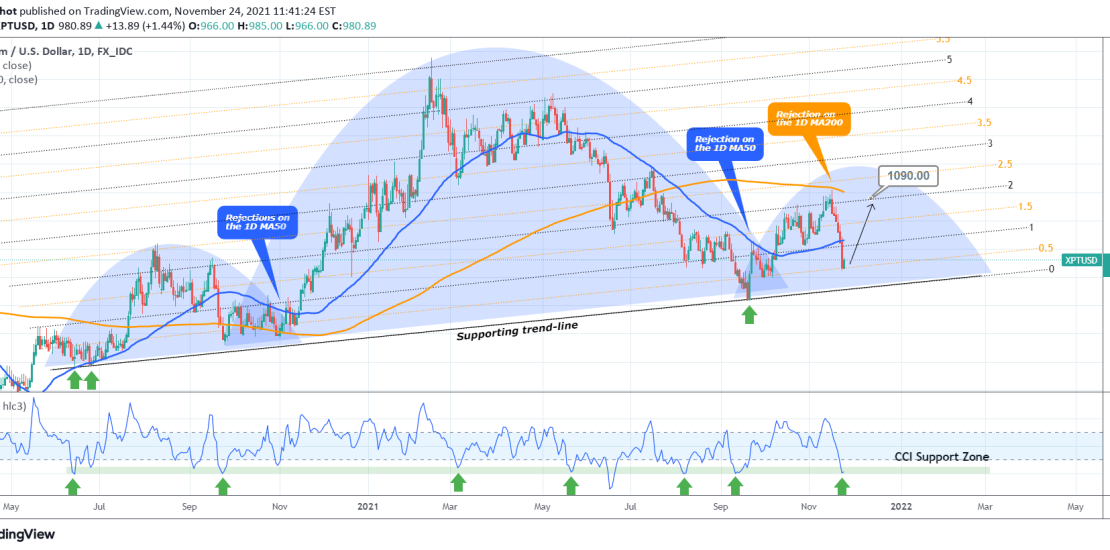
Pattern: Giant Head and Shoulders on 1D. Signal: Buy as the price hit the 0.5 Fibonacci trend-line and is near the Support. The 1D CCI is also on its Core long-term Support. Target: 1090 (potential contact with the 1D MA200 (orange trend-line) and right on the 2.0 Fibonacci extension). Tradingview link: https://www.tradingview.com/chart/XPTUSD/fDBsJTAs-PLATINUM-targeting-1090
-
XAUUSD Correction towards the 1D MA50
- November 22, 2021
- Posted by: Tradingshot Articles
- Category: Commodities
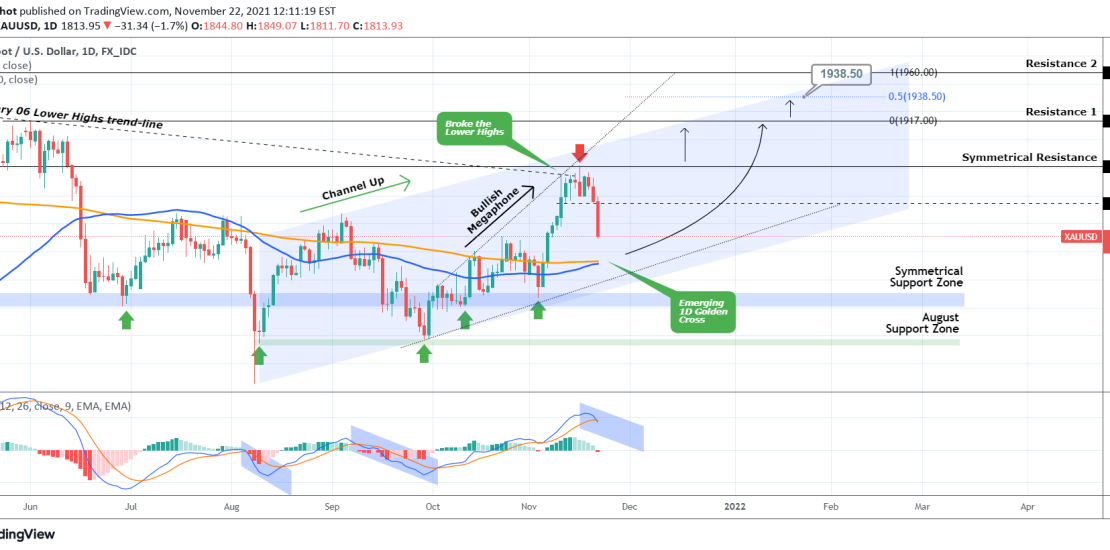
This is an update to the 30 day trading plan I published last week: Obviously as the condition of closing a 1D candle above the 1876 Symmetrical Resistance was not fulfilled, the bullish momentum failed and Gold got heavily rejected today. As mentioned on the trading plan, the natural Support is the 1D MA50
