

-
US10Y Strong rejection on the 1D MA50. Long-term bearish sign?
- June 17, 2021
- Posted by: Tradingshot Articles
- Category: Uncategorized
No Comments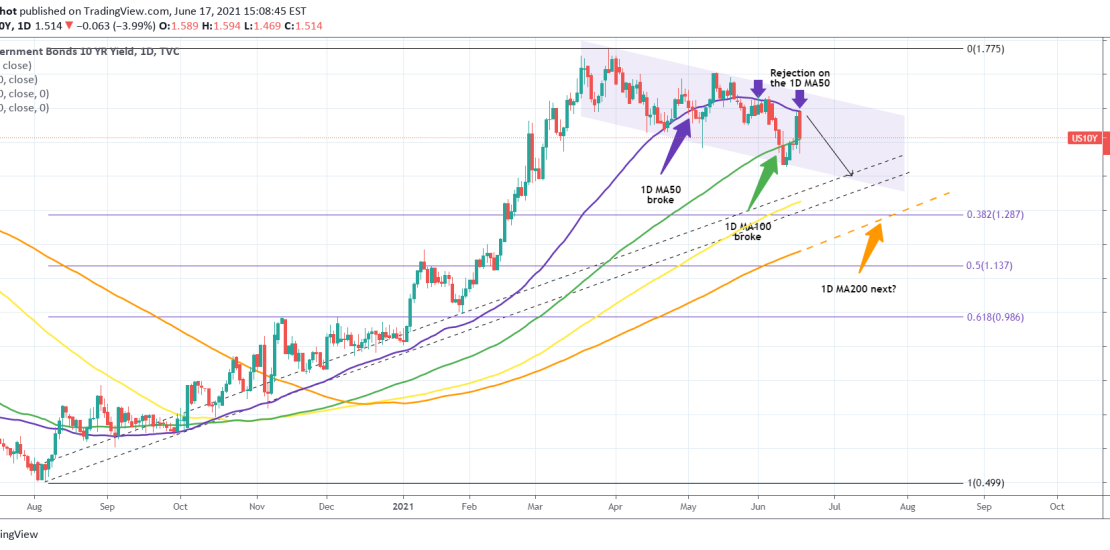
A perfect Channel Down has been formed for the US10Y on the 1D time-frame. The 1D MA50 and 1D MA100 have already been broken. The 1D MA150 (yellow trend-line) is exactly within the Higher Lows Zone from the very bottom of August 2020. Will the 1D MA200 (orange trend-line) get tested right on the
-
S&P500 entering a Golden Decade and no one is paying attention
- June 10, 2021
- Posted by: Tradingshot Articles
- Category: Stock Indices
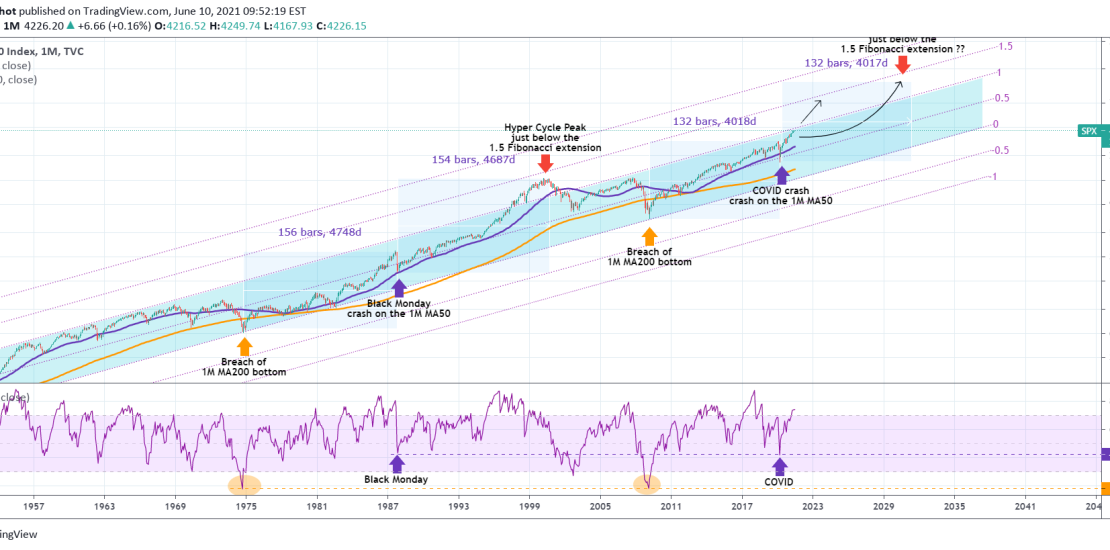
This is S&P on the log scale of the 1M (monthly) time-frame. Since the Great Depression, the index has entered a Channel Up that never stopped/ broke to the downside to this date. In particular, I have distinguished this pattern into 3 key landmarks: 1) When the price broke below the 1M MA200 (orange
-
S&P500 Triangle about to break
- June 8, 2021
- Posted by: Tradingshot Articles
- Category: Stock Indices
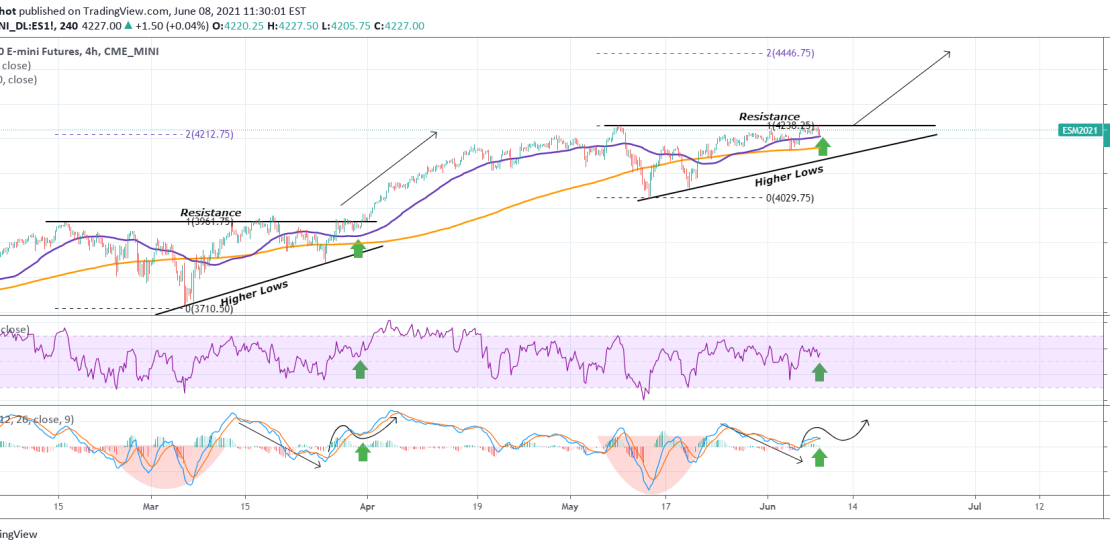
Pattern: Triangle on 4H. Signal: Buy as long as the Higher Lows trend-line holds. Target: 4400 (just below the 2.0 Fibonacci extension, similar to the March 31 break-out). Tradingview link: https://www.tradingview.com/chart/ES1!/uxzuriUl-S-P500-Triangle-about-to-break
-
WTI OIL Is $100 a realistic price target?
- June 7, 2021
- Posted by: Tradingshot Articles
- Category: Commodities
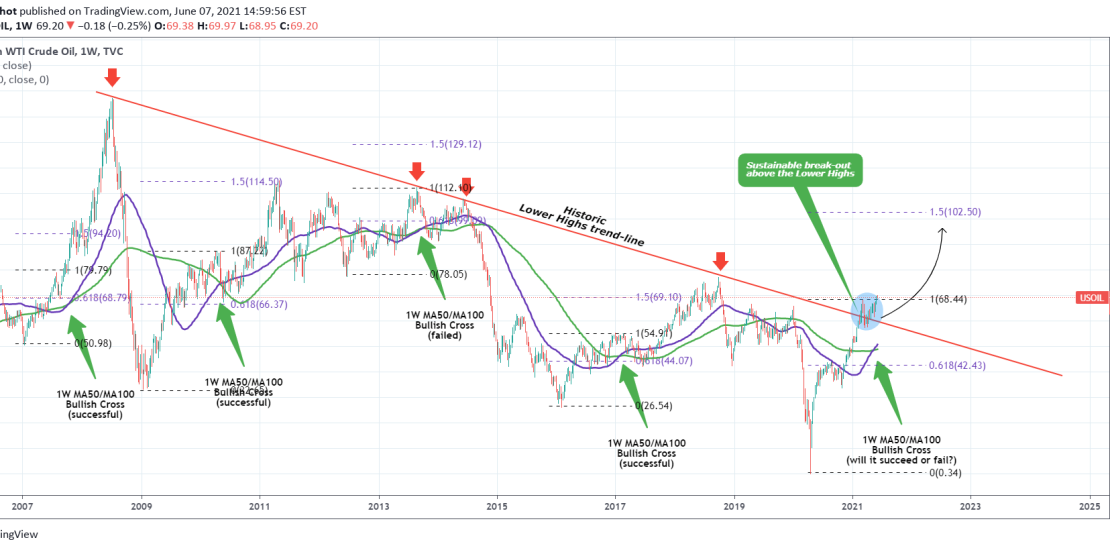
A lot of talk has been made lately around popular assets like Gold’s strength, the selling on BTC and the weakness of the USD while few have been paying attention to WTI Crude Oil’s long-term carts. WTI has silently broken above its Historic Lower Highs trend-line (that has been in effect since the July
-
LUMBER Sell Signal
- June 7, 2021
- Posted by: Tradingshot Articles
- Category: Uncategorized
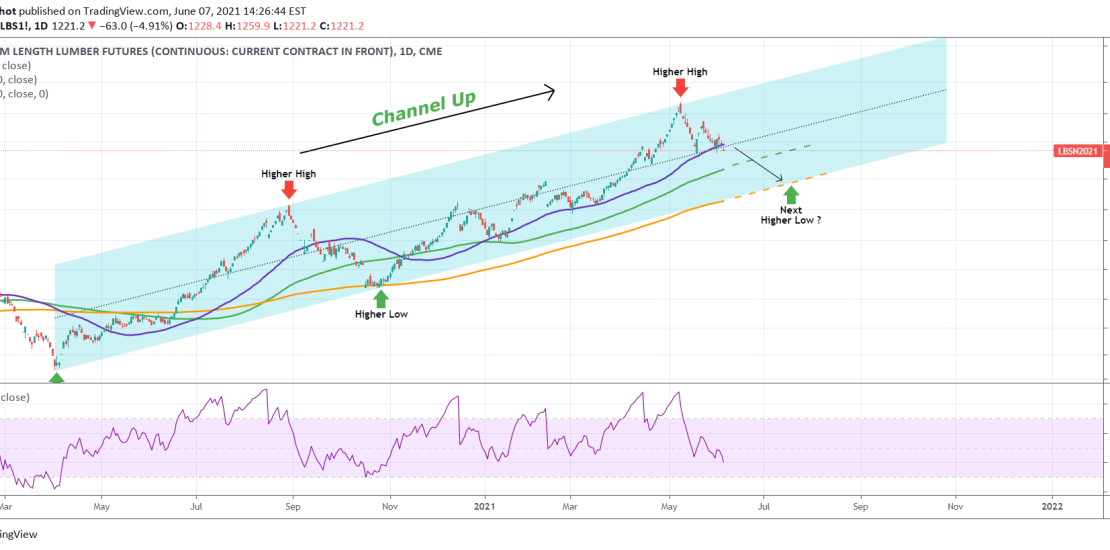
Pattern: Channel Up on 1D. Signal: Sell as the price got rejected on the Higher Highs trend-line of the Channel Up. Target: The 1D MA100 (green trend-line) on the short-term and the 1D MA200 (orange trend-line) on the medium-term. Tradingview link: https://www.tradingview.com/chart/LBS1!/73Rnsbxq-LUMBER-Sell-Signal
-
EURUSD Critical crossroads
- June 7, 2021
- Posted by: Tradingshot Articles
- Category: Forex
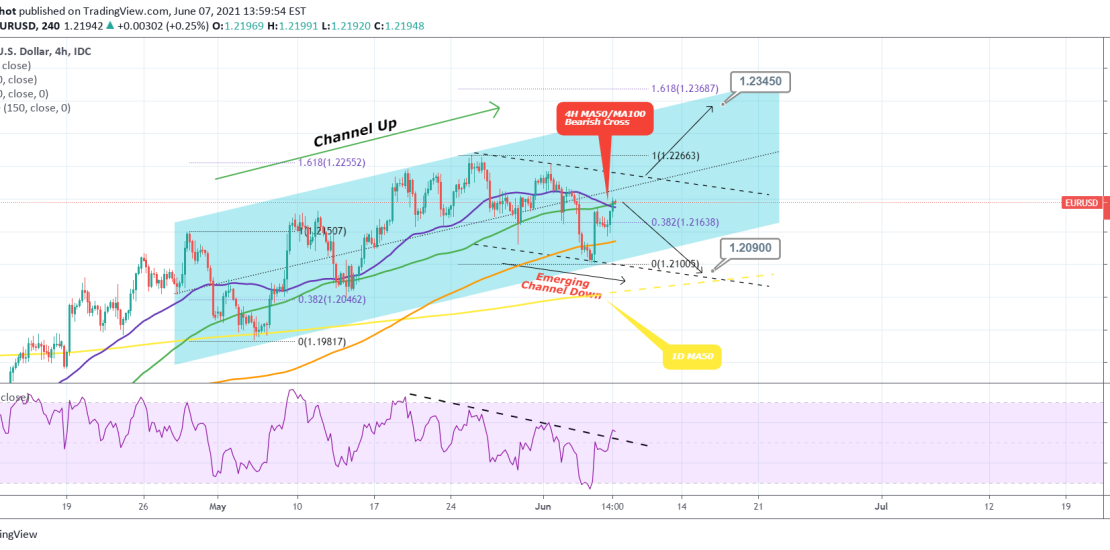
Pattern: Channel Up on 4H but if 1.22390 doesn’t break, a Channel Down may take its place. Signal: (A) Buy if 1.22390 breaks, (B) sell until then as a 4H MA50/MA100 has been formed. Target: (A) 1.23450 (1.618 Fibonacci extension), (B) 1.20900 (Lower Low on the emerging Channel Down and just above the 1D
-
BITCOIN The alts dominance shows this may not be the top for BTC
- June 4, 2021
- Posted by: Tradingshot Articles
- Category: Cryptocurrency
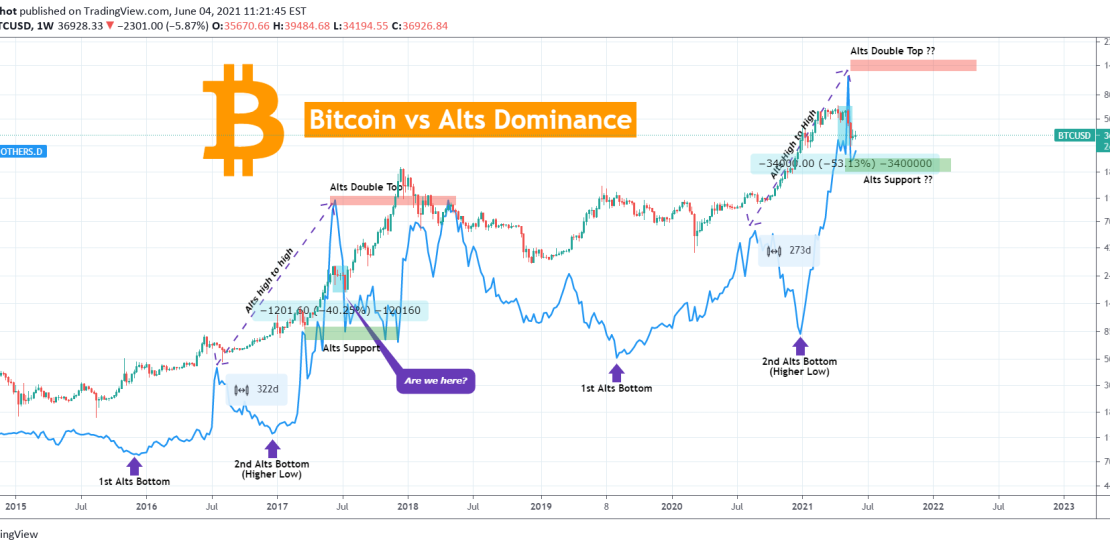
On this study I am crossing Bitcoin with the Dominance of the Alt Coins as it shows something that may interest you. This past month there is only one question in crypto investors’ minds: has Bitcoin already made a top for the current Cycle? The regression of BTC agains the Alts shows that the
-
S&P500 Fractal showing $4255 as target
- June 3, 2021
- Posted by: Tradingshot Articles
- Category: Stock Indices
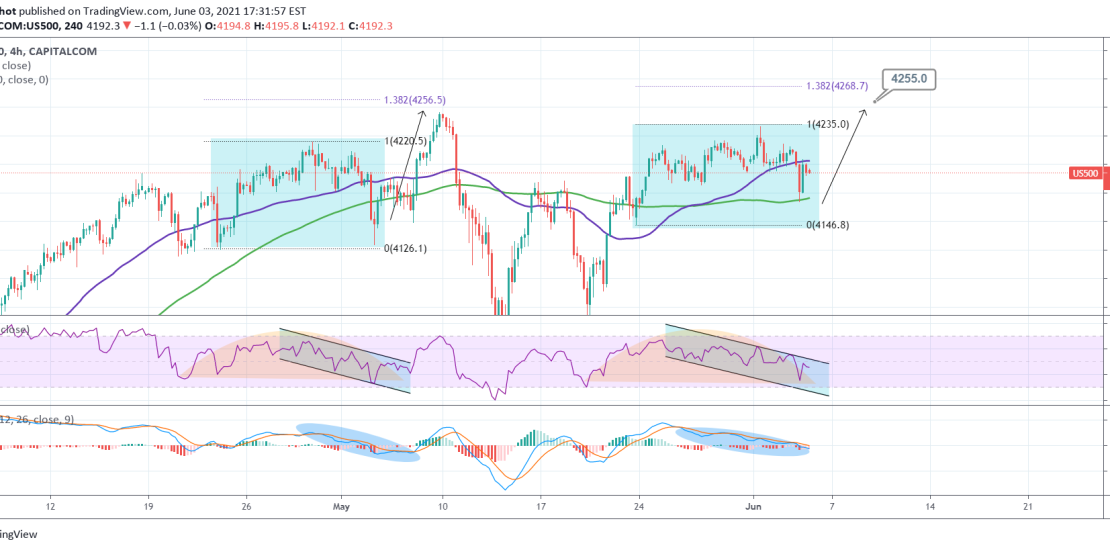
Both in terms of RSI/ MACD and the way the price trades on the 4H MA50 (blue trend-line) and the 4H MA100 (green trend-line), S&P500 appears to be replicating the late April – early May fractal. After a bottom on the Support, the price rebounded just below the 1.382 Fibonacci extension. That is currently
-
BITCOIN The importance of the 1M MA20 and the RSI
- May 28, 2021
- Posted by: Tradingshot Articles
- Category: Cryptocurrency
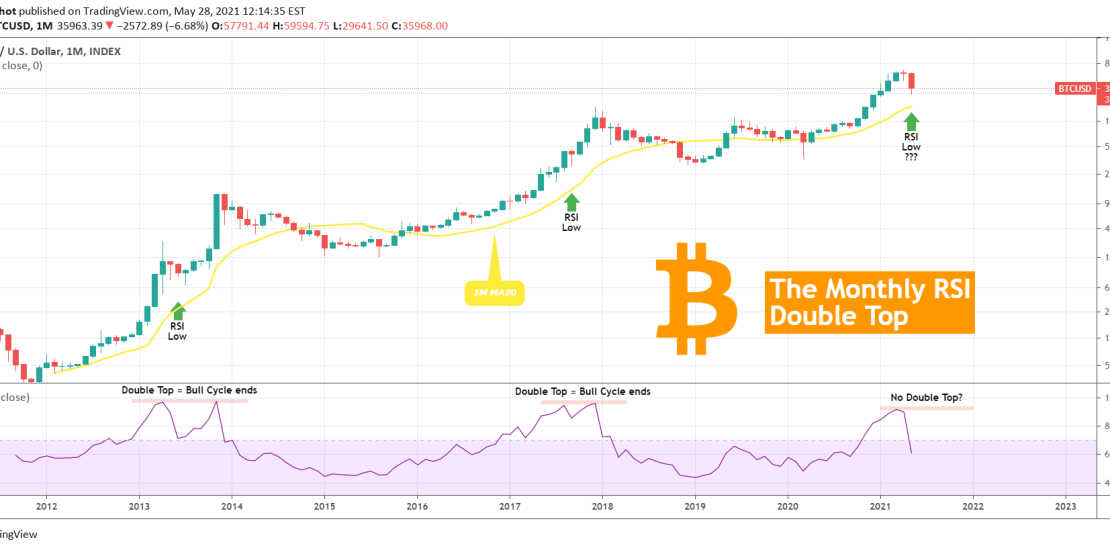
Bitcoin closes the month in 3 days, the worst in terms of losses since the March 2020 flash crash. So far it remains above the 1M MA20 (yellow trend-line) but that alone doesn’t tell much. There is though a parameter on the (very long-term) monthly chart that we haven’t looked into. As you see
-
S&P500 entering the buy zone again
- May 19, 2021
- Posted by: Tradingshot Articles
- Category: Stock Indices
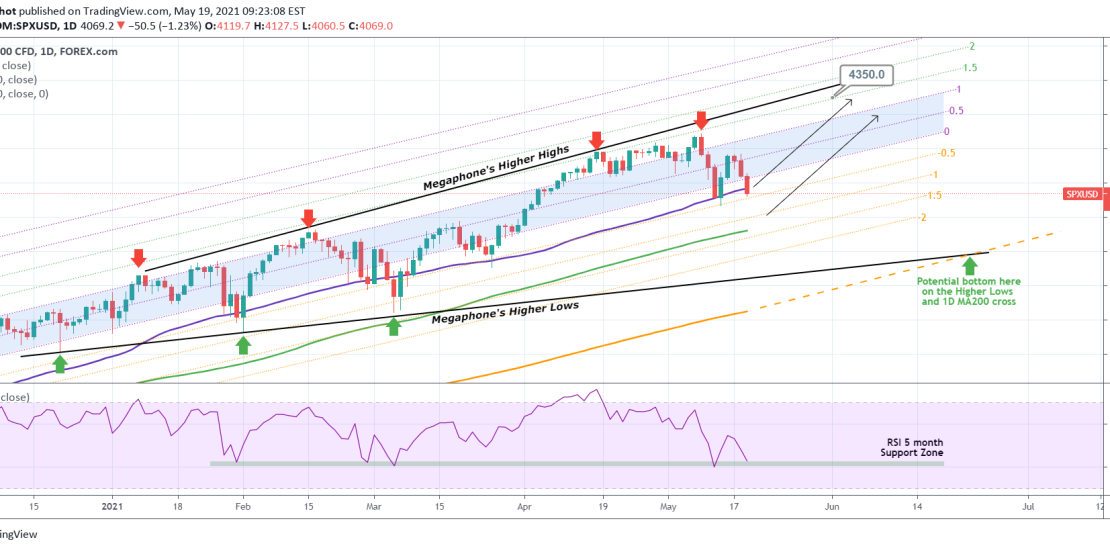
Pattern: Fibonacci Channel on 1D. Signal: Buy as the price entered the 1D MA50 – 1D MA100 buy zone again. The 1D RSI is on the (Support) similar level that it was on the Jan 29, March 04 and May 12 bottoms. Target: 4350 (the 1.5 Fibonacci extension). Previous S&P500 idea: Tradingview link: https://www.tradingview.com/chart/SPXUSD/uLhdCdCY-S-P500-entering-the-buy-zone-again