

- May 28, 2021
- Posted by: Tradingshot Articles
- Category: Cryptocurrency
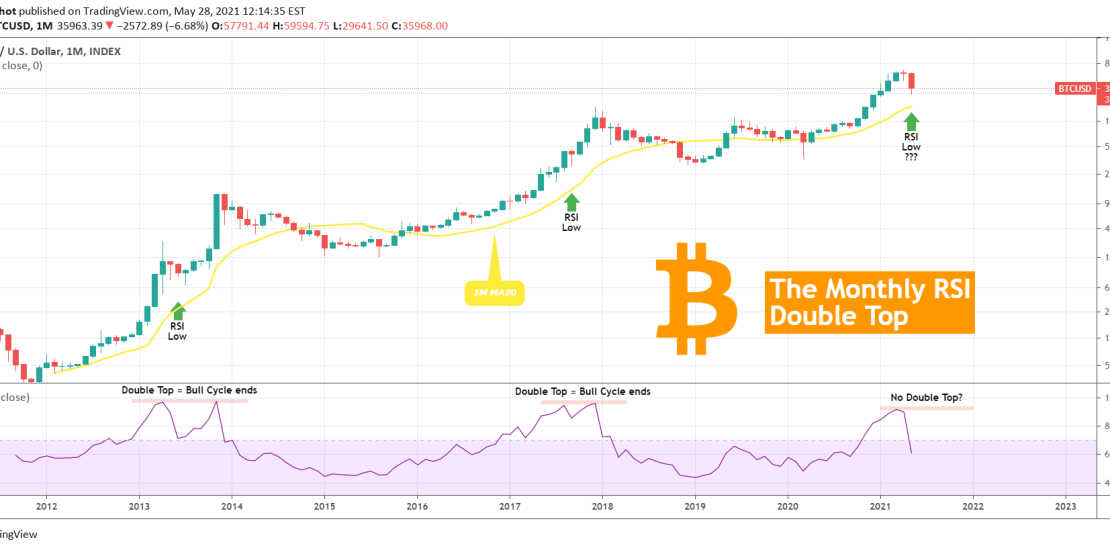
Bitcoin closes the month in 3 days, the worst in terms of losses since the March 2020 flash crash. So far it remains above the 1M MA20 (yellow trend-line) but that alone doesn’t tell much. There is though a parameter on the (very long-term) monthly chart that we haven’t looked into.
As you see on the chart, every Bitcoin Bull Cycle ends with the Monthly RSI making a Double Top. Then the Bear Cycle starts and makes a bottom shortly after it breaks below the 1M MA20.
This time BTC hasn’t had an RSI Double Top, instead the price aggressively dipped at 92.00 (RSI value). If the theory that an RSI Double Top is needed for the Bull Cycle to end, then the price is in a similar position to June 2013 and September 2017.
Further representation of this notion can be seen also on the 1W chart below.
The weekly RSI is attempting contact with its Higher Lows trend-line that started on the 2018 Bear Cycle Bottom.
I want your opinion on this rare formation. Do you think this theory will hold again and give a few more months of Bull run or has Bitcoin already entered a Bear Cycle? Feel free to share your work and let me know in the comments section!
Tradingview link:
https://www.tradingview.com/chart/BTCUSD/JxOQgpPx-BITCOIN-The-importance-of-the-1M-MA20-and-the-RSI