

- June 4, 2021
- Posted by: Tradingshot Articles
- Category: Cryptocurrency
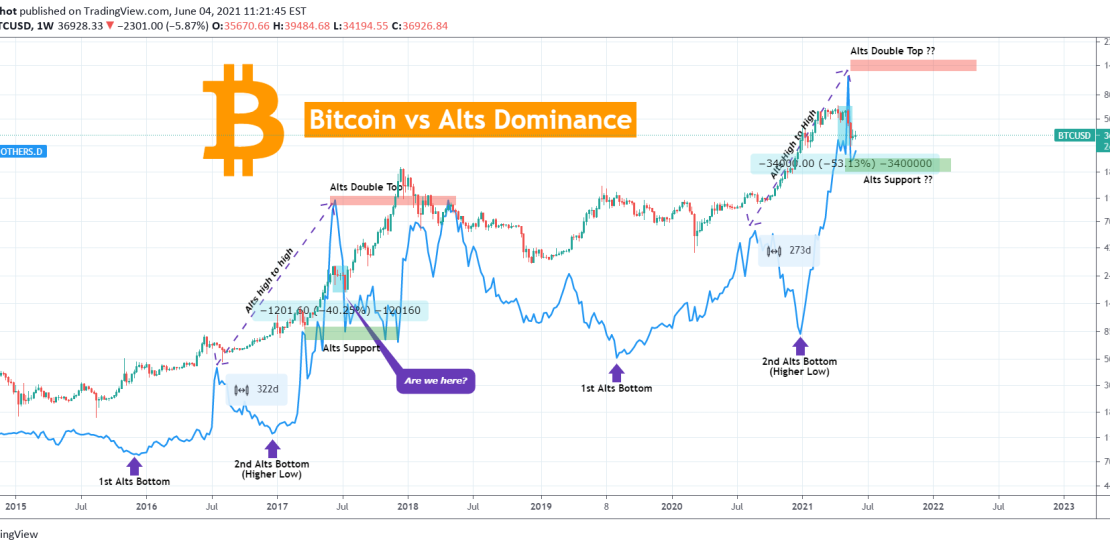
On this study I am crossing Bitcoin with the Dominance of the Alt Coins as it shows something that may interest you.
This past month there is only one question in crypto investors’ minds: has Bitcoin already made a top for the current Cycle? The regression of BTC agains the Alts shows that the pattern they are printing now is similar to July 10, 2017. During that time, BTC dropped -40% along, while the Alts that were having their 2nd Parabolic Phase dropped even more dramatically. While BTC recovered almost instantly, the drop formed a Support for the Alts Dominance that attracted the price up until BTC’s new Cycle Top. As you see on the chart, the Alts have had two bullish phases within the greater Bull Cycle and the duration from the 1st High to the 2nd was a little over 300 days. On the current Cycle that time range is a little below 300 days.
I know that, as most say lately, “this time is different” but that if it is not and this comparison shows the way? What do you think, does this study accurately depicts the place on the trend that BTC is currently at or the Top is already in?
Feel free to share your work and let me know in the comments section!
Tradingview link: