
-
S&P500 Emerging Golden Cross on 4H.
- October 15, 2021
- Posted by: Tradingshot Articles
- Category: Stock Indices
No Comments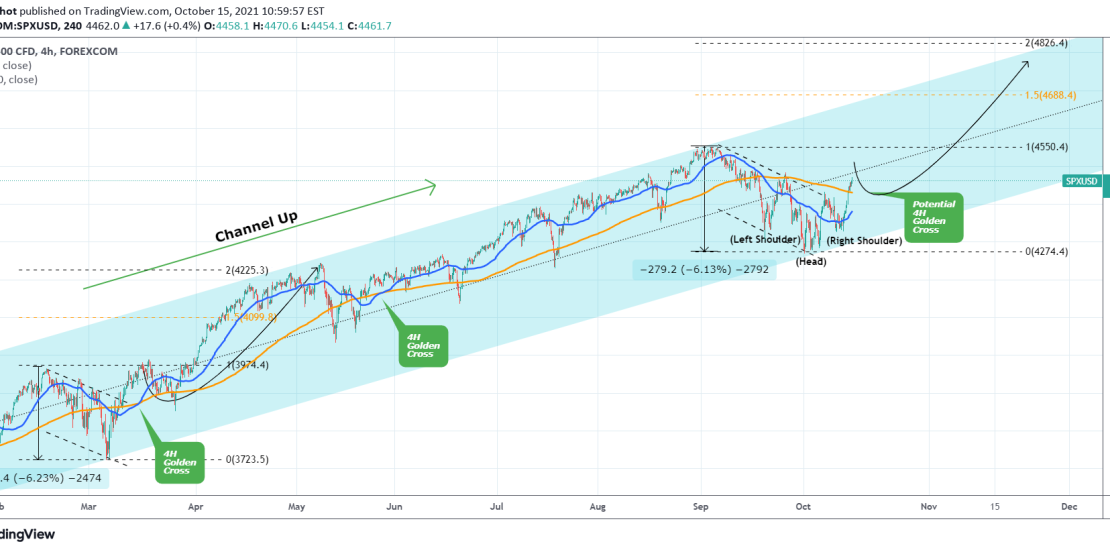
My most recent analysis on S&P500 was 15 days ago, when I talked about why the Bearish Ichimoku was in fact a bullish signal: As it turned out, the signal was accurate and SPX made a bottom on the Higher Lows trend-line of the Channel Up and rebounded. In fact it even broke above
-
XAUUSD 4H MA50 holding, emerging Golden Cross inside a ChannelUp
- October 15, 2021
- Posted by: Tradingshot Articles
- Category: Commodities
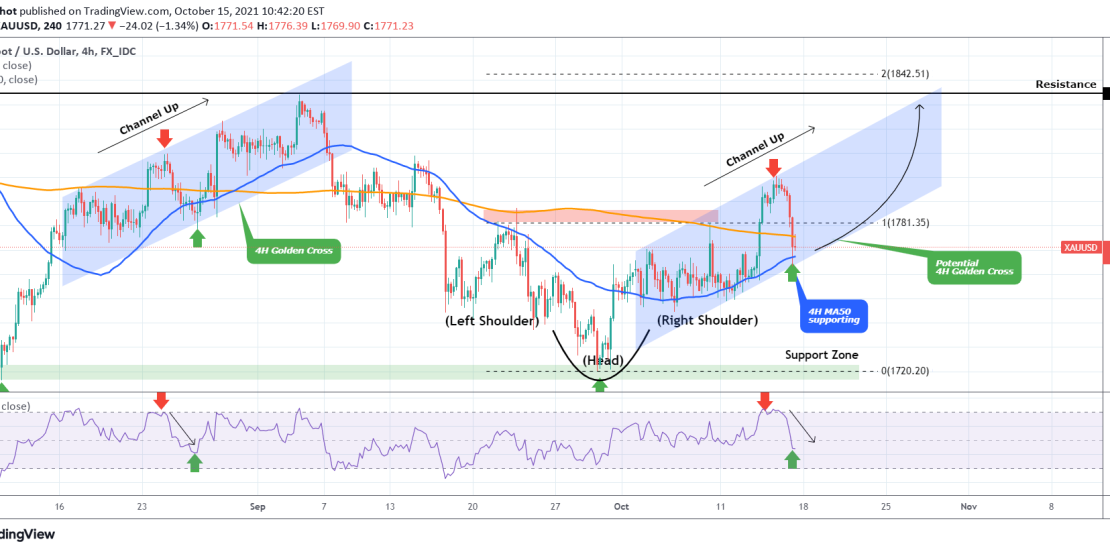
This is a follow up to my most recent Gold analysis: The Inverse Head and Shoulders pattern worked perfectly and the price easily broke above the 4H MA200 (orange trend-line). As it got rejected on the psychological 1800 level, the potential of a Channel Up emerges, similar to that of August that tested the
-
DAX Broke above the 4H MA50. Buy Signal.
- October 13, 2021
- Posted by: Tradingshot Articles
- Category: Stock Indices

Pattern: Channel Up on 4H. Signal: Buy as the price broke above the 4H MA50. Target: 15500 (just below the 4H MA200). Tradingview link: https://www.tradingview.com/chart/DE40/lQZC7m65-DAX-Broke-above-the-4H-MA50-Buy-Signal
-
DOW JONES Buy Signal
- October 13, 2021
- Posted by: Tradingshot Articles
- Category: Stock Indices
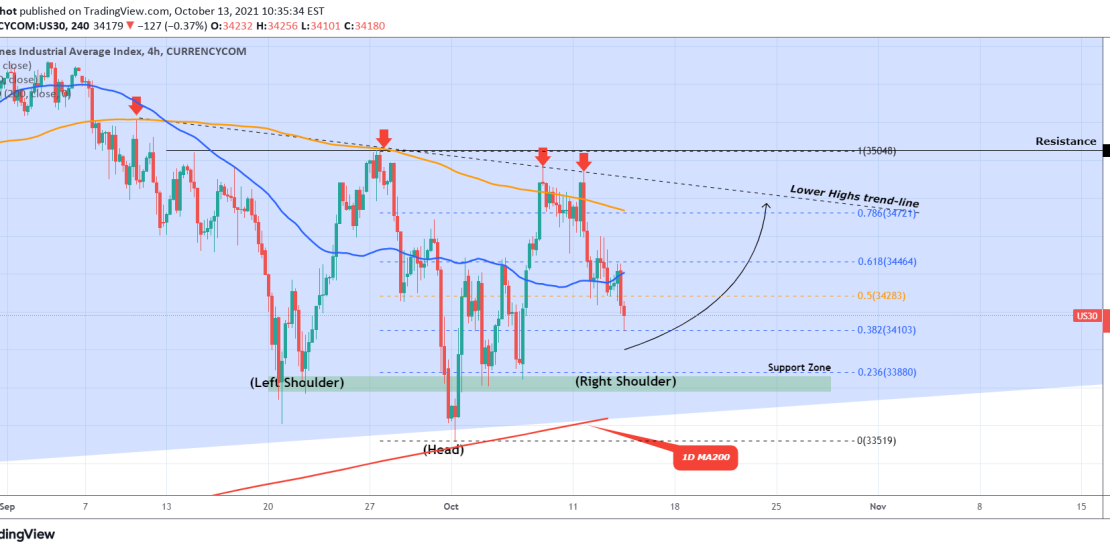
Pattern: Inverse Head and Shoulders on 4H. Signal: Buy as the price is close to completing the Right Shoulder and is on the 0.382 Fibonacci retracement level. Target: 34700 which is the 0.786 Fibonacci retracement level just below the Lower Highs trend-line. Tradingview link: https://www.tradingview.com/chart/US30/WrZ0DBte-DOW-JONES-Buy-Signal
-
XAUUSD Consolidating on the 4H MA50
- October 5, 2021
- Posted by: Tradingshot Articles
- Category: Commodities
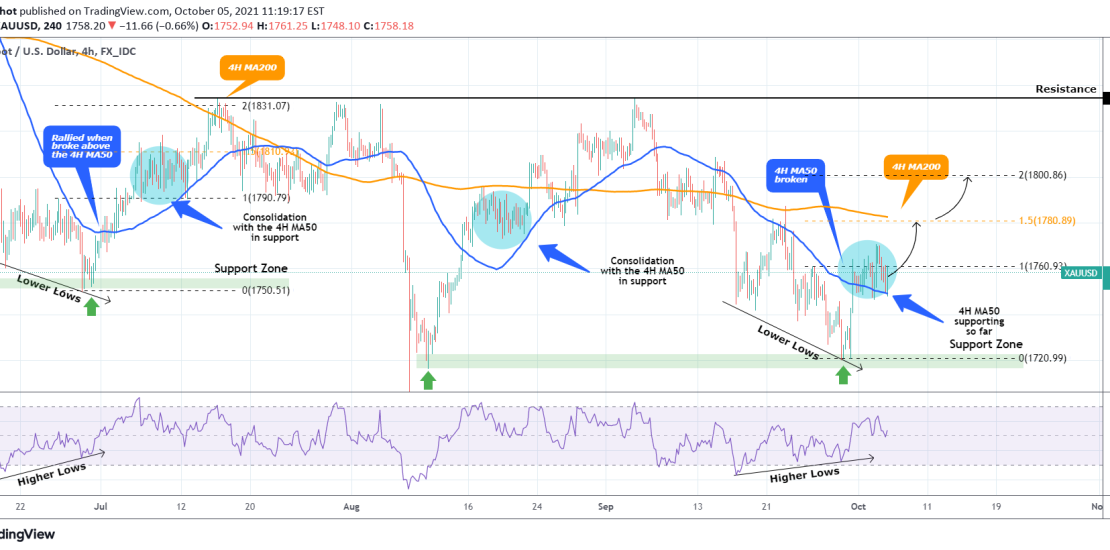
As per the last XAUUSD idea, the price broke above the 4H MA50 (blue trend-line) giving a strong buy break-out signal: Right now the price is consolidating with the 4H MA50 in support, much like the July and August fractals (circles). Naturally the next target remains the 4H MA200 (orange trend-line) around 1780 and
-
WTI OIL turning Parabolic Towards $82.50.
- October 5, 2021
- Posted by: Tradingshot Articles
- Category: Commodities
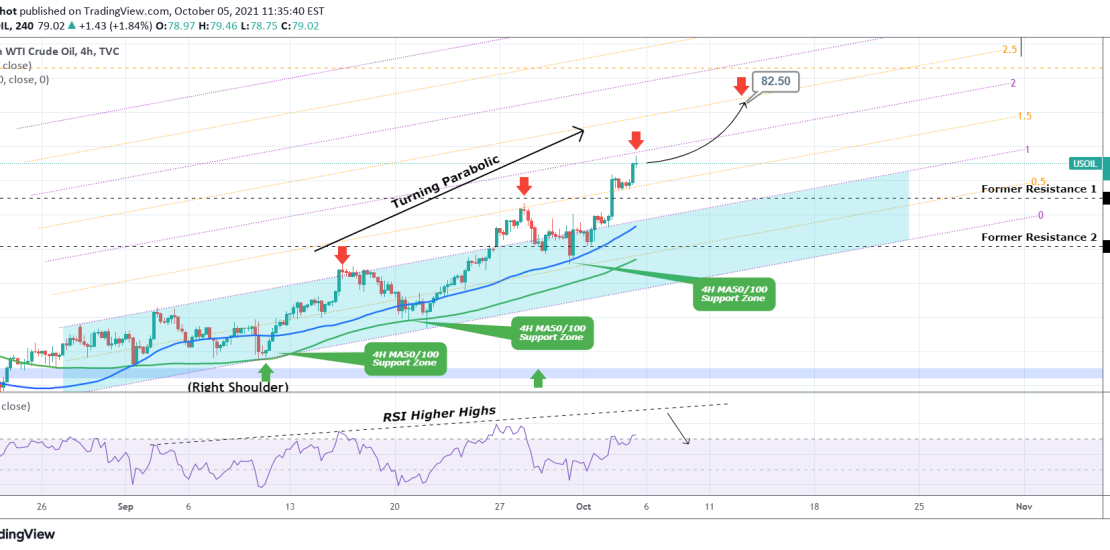
Since WTI Oil broke the former two Resistance levels (74.15 and 77.00), the price turned parabolic outside the Channel Up that dominated most of the price action in September. There seems to be a Buy/ Support Zone consisting of the 4H MA50 (blue trend-line) and the 4H MA100 (green trend-line) and a Resistance Zone
-
NASDAQ on 1D Buy Signal
- October 4, 2021
- Posted by: Tradingshot Articles
- Category: Stock Indices
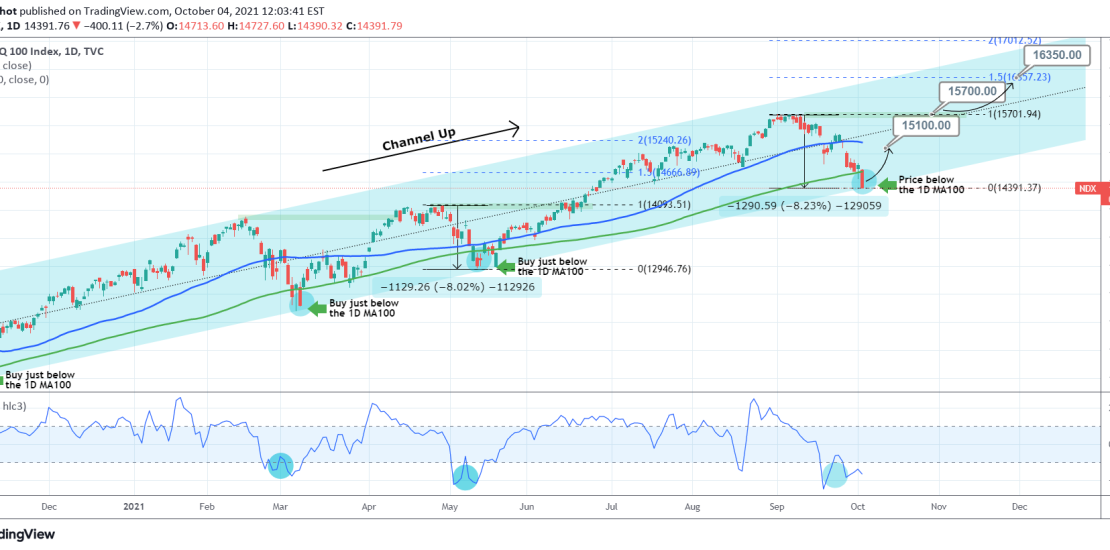
Pattern: Channel Up on 1D. Signal: Buy as the price is at the bottom of the Channel Up, below the 1D MA100 (green trend-line, which has accurately given a long-term buy signal 3 times since November 2020) and the 1D CCI is on Higher Lows at its bottom. Target: Short-term 15100 (the 1D MA50),
-
DAX hit the 1D MA200, first time since the US elections!
- October 1, 2021
- Posted by: Tradingshot Articles
- Category: Stock Indices
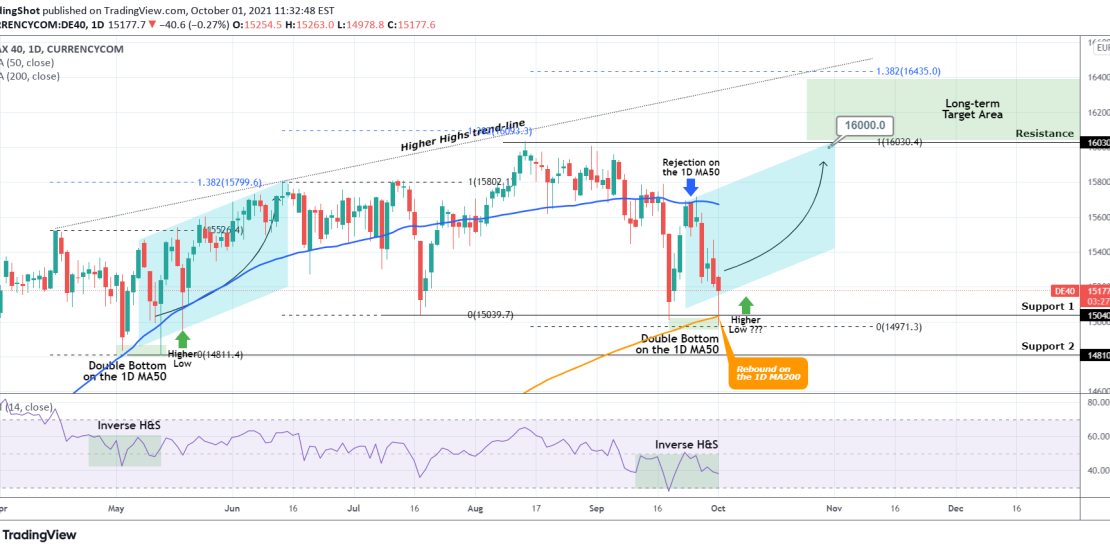
DAX hit today the 1D MA200 (orange trend-line) for the first time since November 04 2020, which was the period of the U.S. elections. That was at the start of a very aggressive end-of-the-year rally. Right now the index is rebounding after having made a Double Bottom just below the 15040 Support. If we
-
DOW JONES hit 1DMA200 for the 1st time since the US elections!
- October 1, 2021
- Posted by: Tradingshot Articles
- Category: Stock Indices
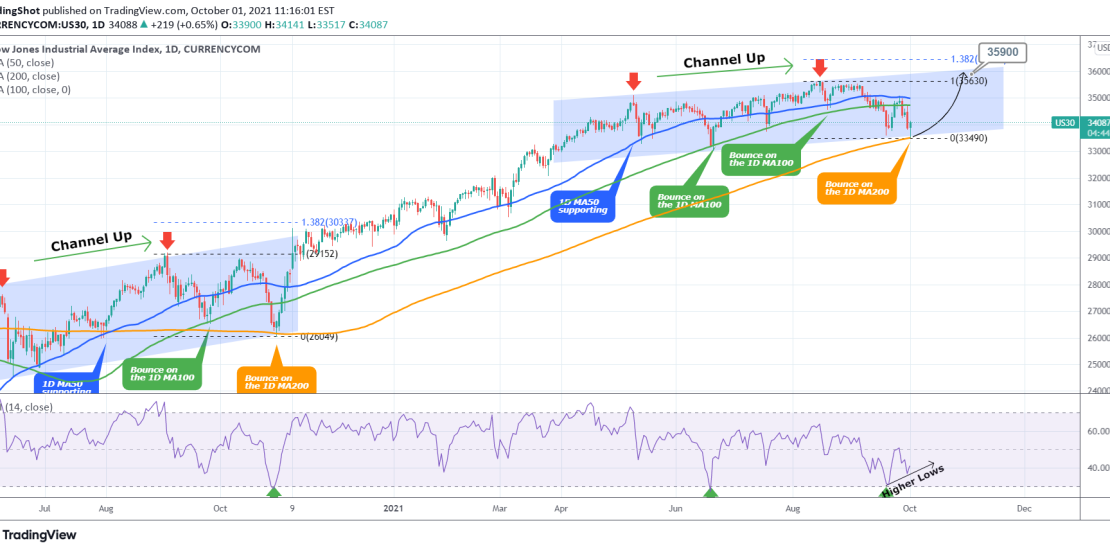
Dow Jones is trading within a Channel Up that reached today its Higher Lows trend-line (bottom). But perhaps the most important development is that in doing so, it hit the 1D MA200 (orange trend-line) for the first time since October 30 2020 (the U.S. elections)! That alone is a strong buy signal itself but
-
S&P500 Ichimoku turned red but is it a bearish signal?
- October 1, 2021
- Posted by: Tradingshot Articles
- Category: Stock Indices
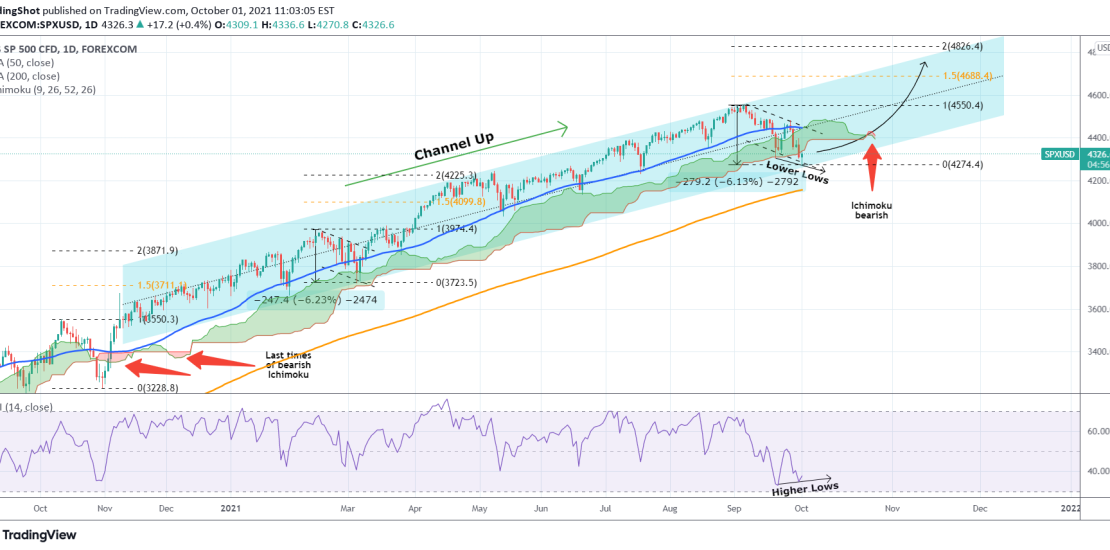
S&P has been trading within a long-term Channel Up ever since the aggressive rebound straight after the November 2020 U.S. elections. Today the price just hit the bottom (Higher Lows trend-line) of that Channel. There are two high probability scenarios arising after September’s pull-back: a) This pull-back is similar to late February – early
