

2023 April
-
NZDUSD Trade long-term based on this Channel Down.
- April 24, 2023
- Posted by: Tradingshot Articles
- Category: Forex
No Comments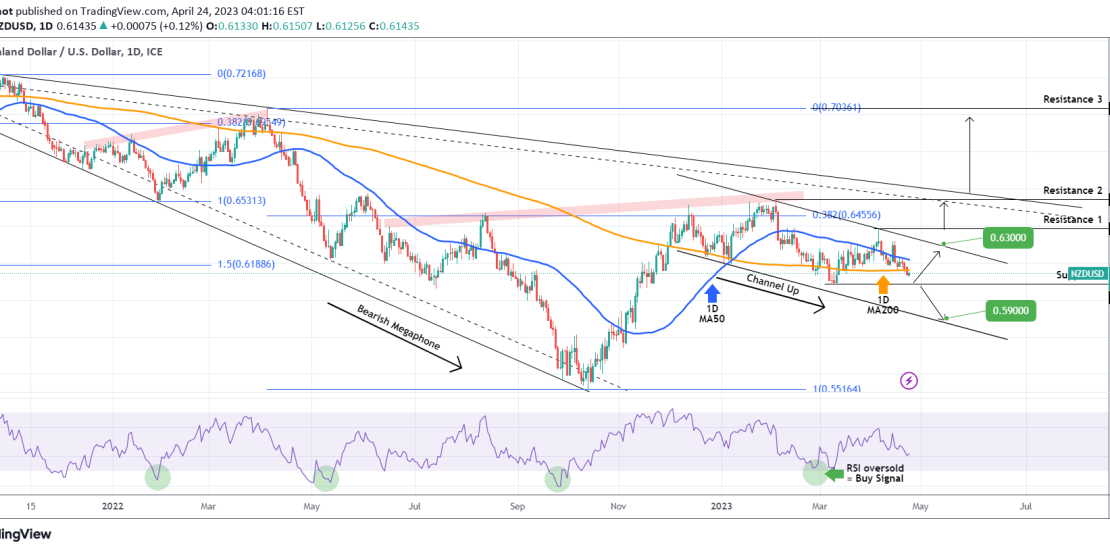
The NZDUSD pair is trading within a Channel Down pattern, having just broken below the 1D MA200 (orange trend-line). The short-term Resistance is the 1D MA50 (blue trend-line). The key here is the 0.60850 Support. As long as it holds, expect a rise back to the top of the Channel Down, with our target being
-
BITCOIN Cycle Phases in a very demonstrative way!
- April 24, 2023
- Posted by: Tradingshot Articles
- Category: Cryptocurrency
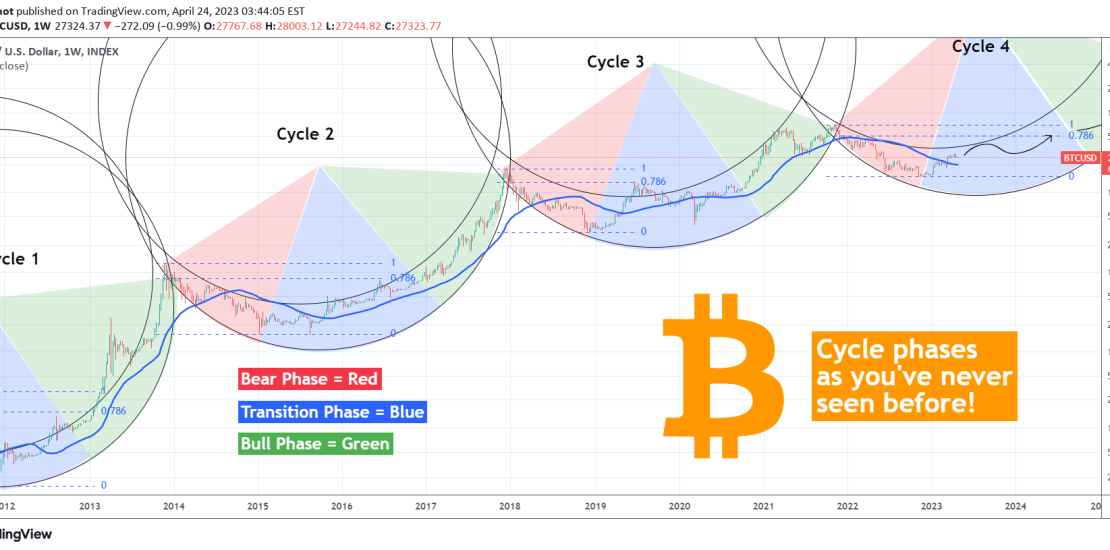
post, we are looking into Cyclical phase and demonstrate them in a way like you’ve never seen before! Each Cycle consists of the Bear (red), Transition (blue) and Bull (green) Phases. The Bear Phase ends at the bottom of the Cycle, where the Transition starts and typically after the price breaks above the 0.786 Fibonacci
-
POLYUSD testing the 2021 Resistance!
- April 21, 2023
- Posted by: Tradingshot Articles
- Category: Cryptocurrency
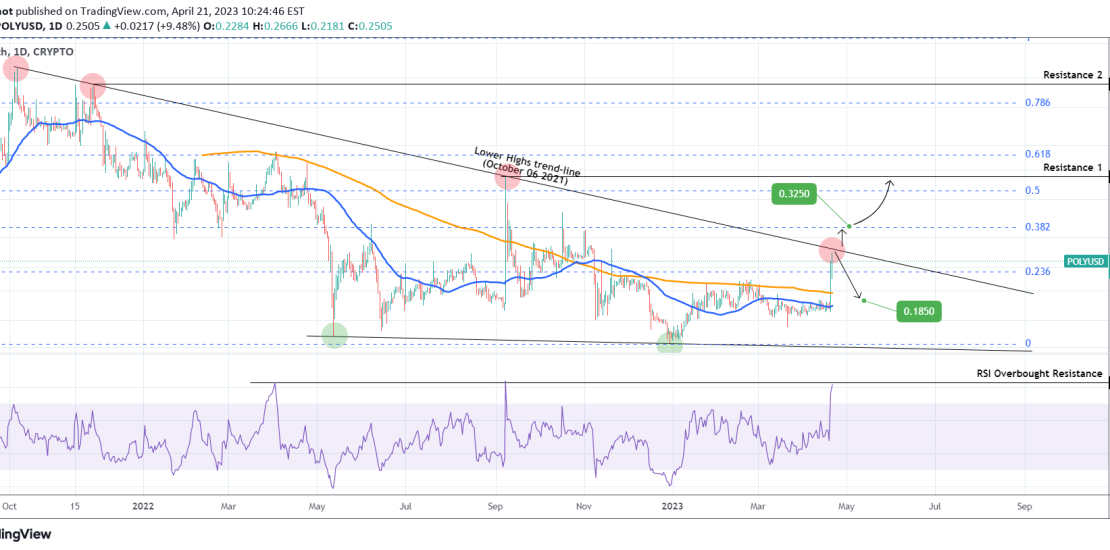
Polymath (POLYUSD) is having an incredible 2-day stretch and is testing the Lower Highs trend-line (from October 06 2021) for the first time September 08 2022. A 1D candle closing above it will be a buy signal for us, targeting 0.3250 (the 0.382 Fibonacci) on the short-term and if another candle closes above it, then
-
BITCOIN being pumped after China bonds macro cycle bottom
- April 21, 2023
- Posted by: Tradingshot Articles
- Category: Cryptocurrency
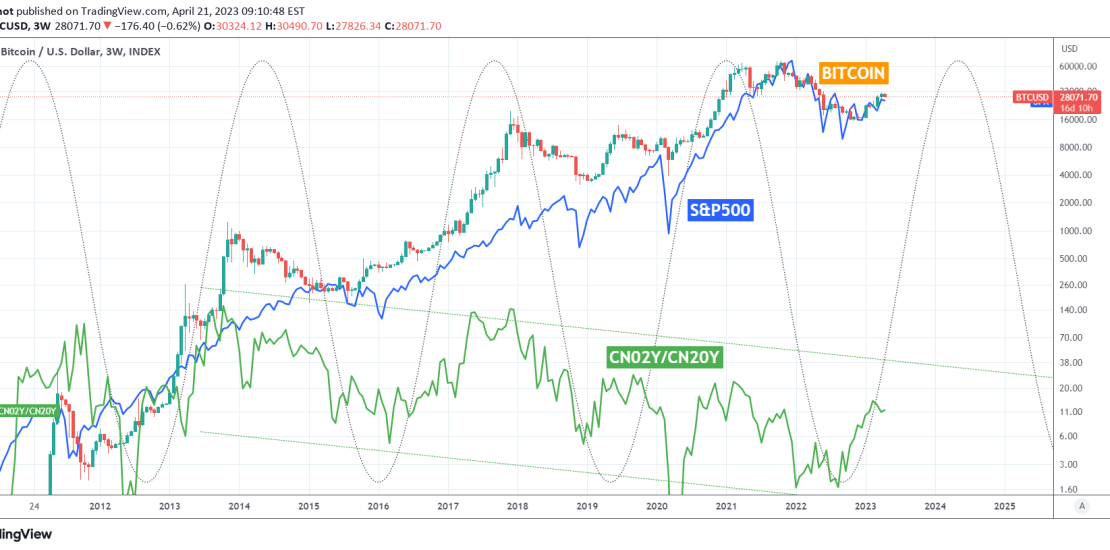
It is not the first time we look into how the Chinese bonds (with our unique CN02Y/CN20Y ratio displayed by the green trend-line) affect Bitcoin’s (BTCUSD) Cycles: It is however the first time we add stocks (S&P500 with the blue trend-line) in the mix. We can see the Cyclical behavior of the bond yields ratio
-
S&P500 Cyclical buy signal starting next month
- April 21, 2023
- Posted by: Tradingshot Articles
- Category: Stock Indices
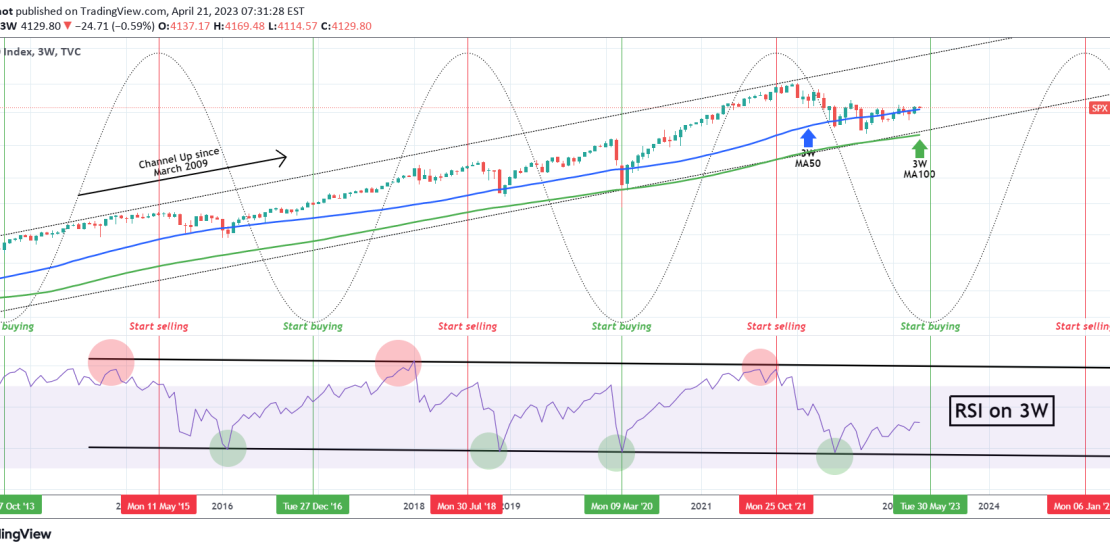
This analysis is basically an extension of the study we published last week, explaining how the index is starting an aggressive expansion: Based purely on the 3W time-frame, now we have incorporated the Sine Waves to clearly display the cyclical buy/ sell pattern inside the long-term Channel Up that started at the bottom of the
-
BITCOIN The next leg up can reach $40000
- April 19, 2023
- Posted by: Tradingshot Articles
- Category: Cryptocurrency
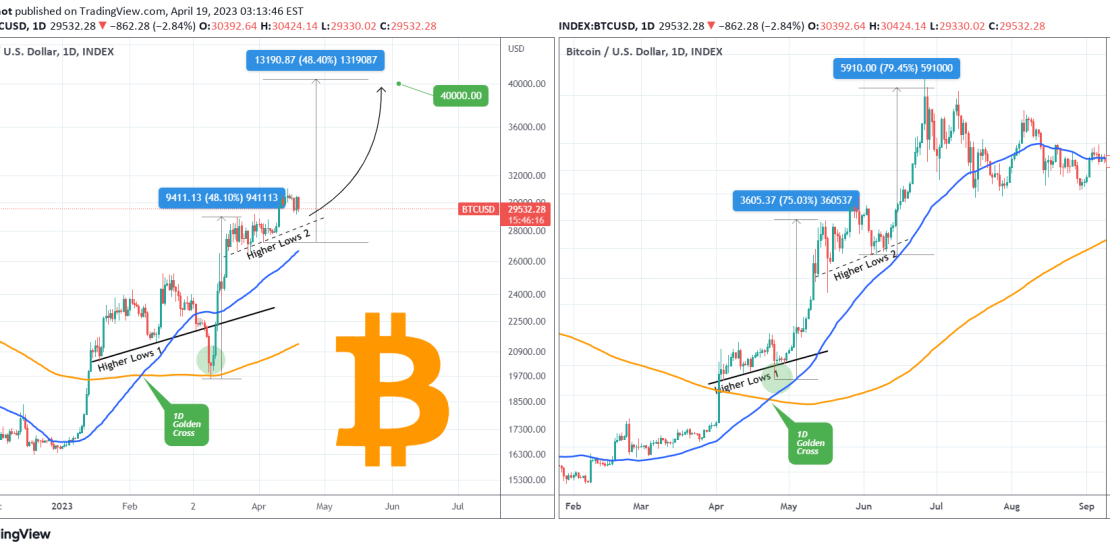
Bitcoin (BTCUSD) continues to follow the pattern of February – June 2019. The consolidation on the Higher Lows 1 has now been succeeded by a consolidation on Higher Lows 2. On June 10 2019 that started the final rally, roughly symmetrical to the one that took the price from Higher Lows 1 to Higher Lows
-
CTSIUSD targeting 0.5500 in two possible scenarios
- April 19, 2023
- Posted by: Tradingshot Articles
- Category: Cryptocurrency
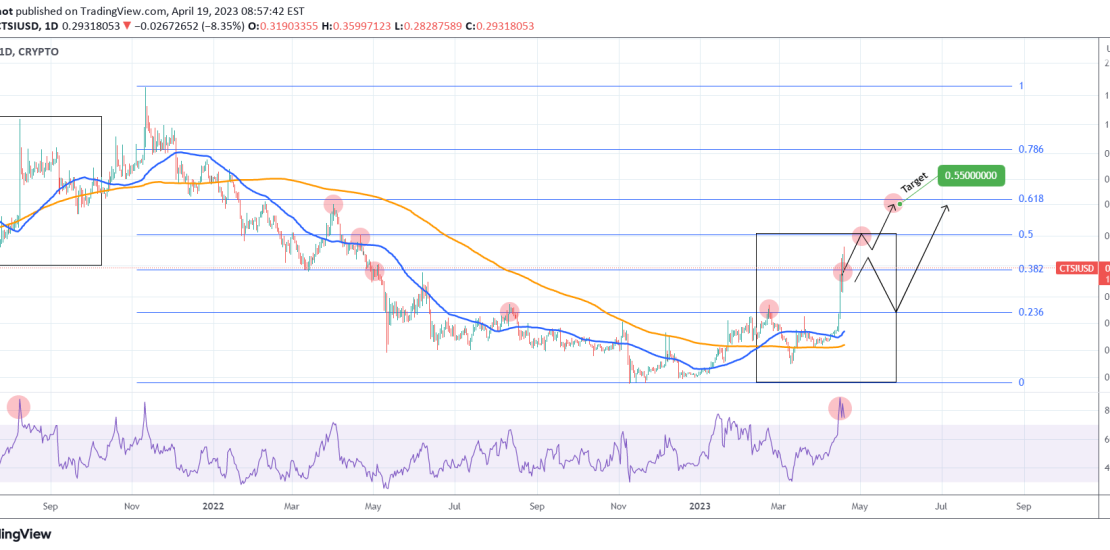
Cartesi (CTSIUSD) emphatically broke above the 0.382 Fibonacci and is headed for the 0.5 Fibonacci (0.4000). With the 1D RSI massively overbought having almost hit 90.00 three days ago, it is possible to see a pull-back to the 0.236 Fib similar to September 2021. As long the 0.382 Fib holds, we may target the 0.618
-
WTI OIL Broke below the 4H MA50. Sell confirmed.
- April 18, 2023
- Posted by: Tradingshot Articles
- Category: Commodities
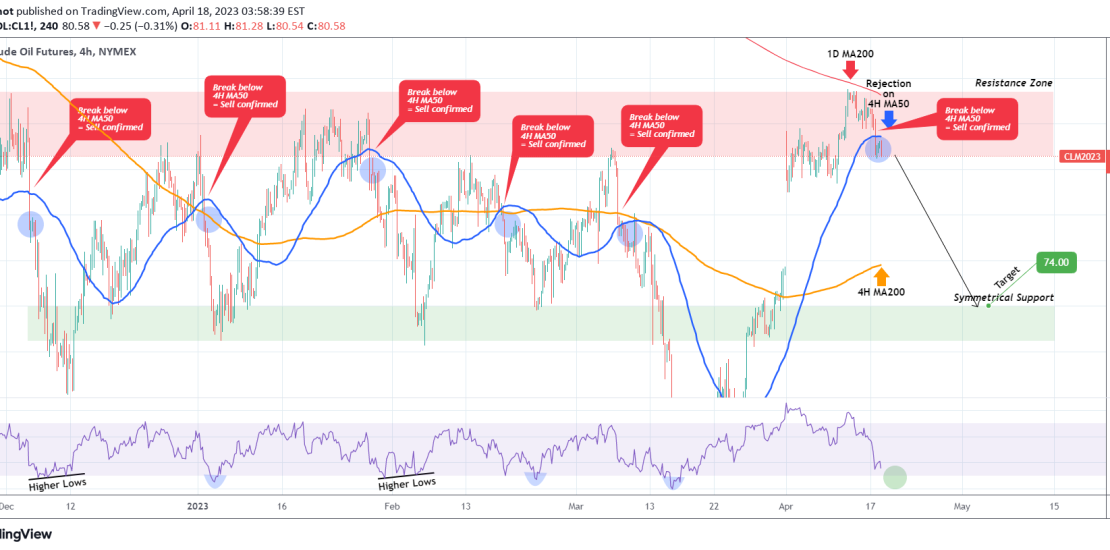
WTI OIL (USOIL) broke yesterday below its 4H MA50 (blue trend-line) and today upon re-testing it as a Resistance, it is currently being rejected. This is a major sell signal as since December 2022 inside the Resistance Zone, every such break-out was a confirmed sell. All prior 5 cases hit the Support Zone shortly after.
-
XAUUSD Short-term pull-backs mean nothing
- April 17, 2023
- Posted by: Tradingshot Articles
- Category: Commodities
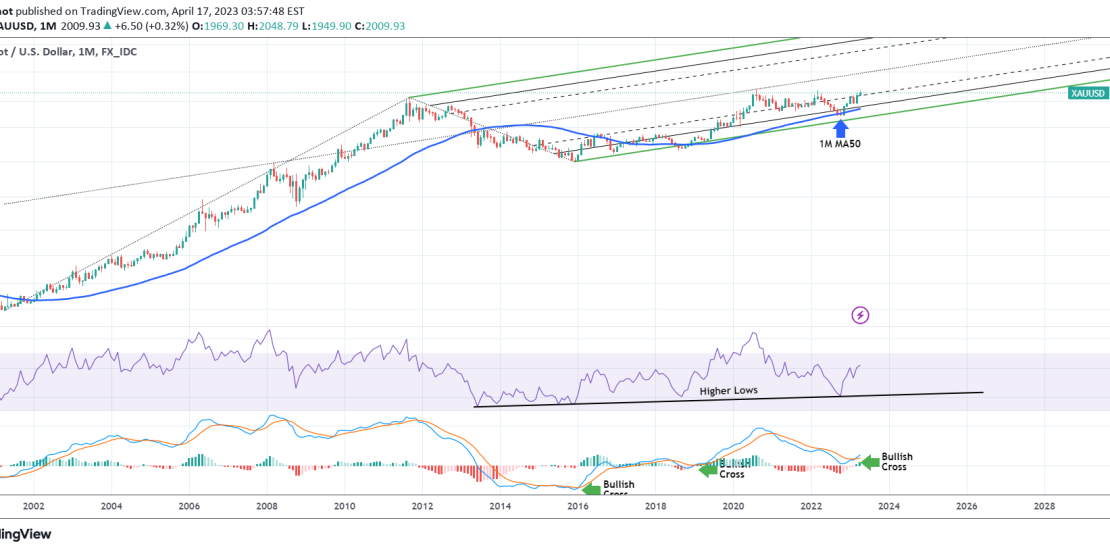
This is Gold (XAUUSD) on the 1M (monthly) chart where the long-term direction is best seen. Apart from the fast that it has been rebounding on the 1M MA50 (blue trend-line) since October, we can see that it has been trading within a Pitchfork, treating each trend-line as Resistance/ Support. At the same time, it
-
BITCOIN Don’t sleep on this Megaphone
- April 17, 2023
- Posted by: Tradingshot Articles
- Category: Cryptocurrency
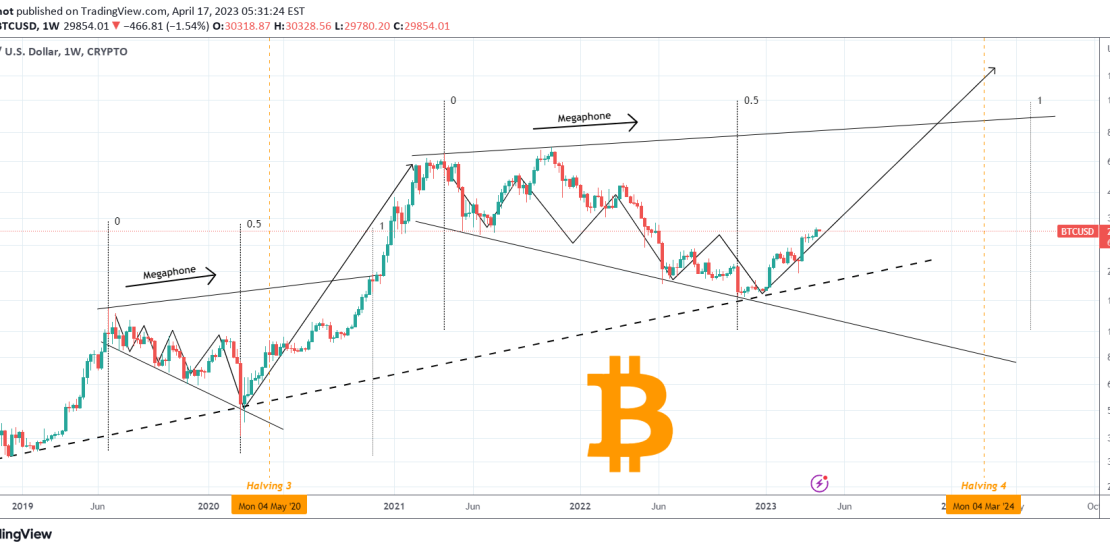
The Megaphone pattern you see on this 1W chart certainly doesn’t get enough attention as other, most cyclical and systemic patterns prevail. Bitcoin (BTCUSD) however has formed a similar structure during the previous Bull Cycle, right after the first rally top. The moment that pattern broke to the upside (Fibonacci 1.0), the price spent as