

2022
-
S&P500 about to test the 1D MA50 for 1st time since April
- July 8, 2022
- Posted by: Tradingshot Articles
- Category: Stock Indices
No Comments
The S&P500 index (SPX) has completed three straight green 1D candles and is approaching the 1D MA50 (blue trend-line) for a test that would be its first since April 21. This idea is basically a continuation of out analysis posted two weeks ago, exactly at the bottom (Lower Low) of the Channel Down: With
-
XAUUSD Flash crash to 1680 still possible.
- July 8, 2022
- Posted by: Tradingshot Articles
- Category: Commodities
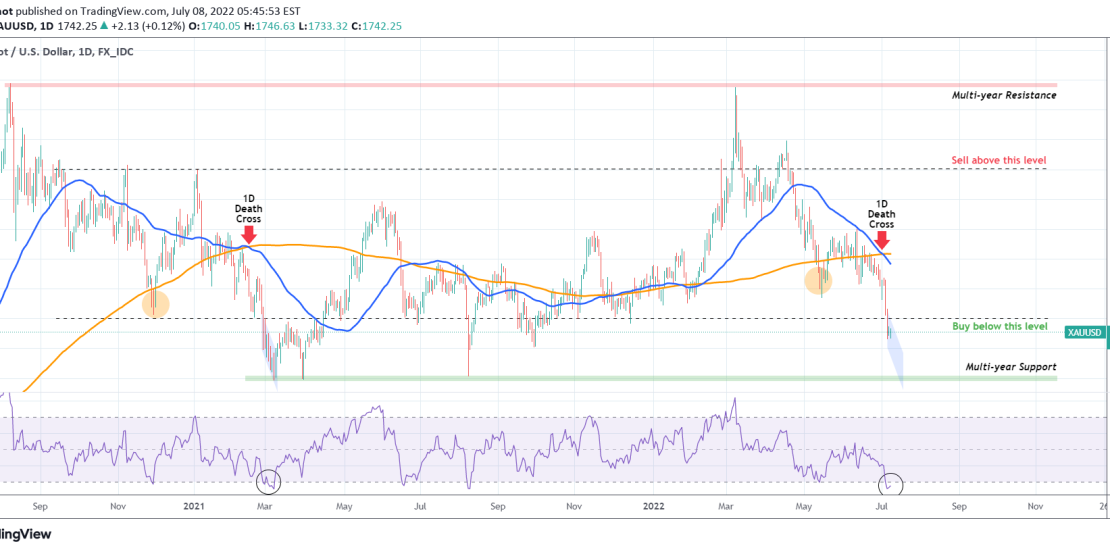
Gold (XAAUSD) broke this week below the 30.000 1D RSI for the first time since August 2021. It was only a week ago when we warned of this potential collapse based on the following 1M (monthly) structure: Now on this 1D time-frame analysis, we see that following the 1D Death Cross (when the 1D
-
EURUSD Approaching parity for 1st time since 2002 ahead of NFP!
- July 8, 2022
- Posted by: Tradingshot Articles
- Category: Forex

The EURUSD pair is on the 6th straight red 1D candle as it is headed towards the 1.000 level (parity) for the first time since December 2002! This may have come as a big surprise to many market participants but it was a realistic scenario based on the pair’s multi-year Cycles that I pointed
-
EURJPY Sell opportunity medium-term
- July 7, 2022
- Posted by: Tradingshot Articles
- Category: Forex
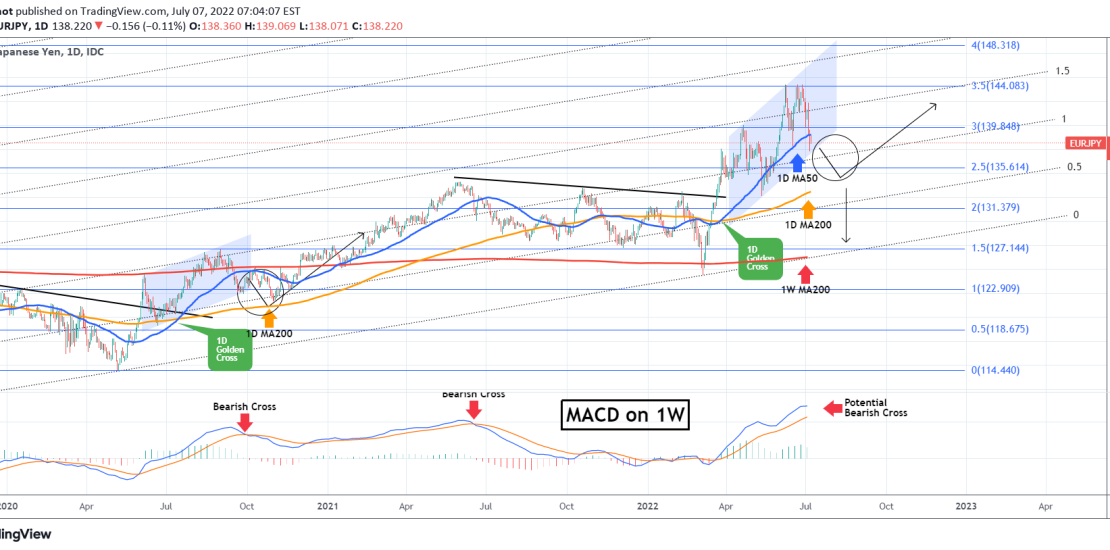
The EURJPY pair has been on a long-term bullish trend since the May 2020 bottom, best illustrated with the help of the Fibonacci Channel on this 1D time-frame. The price broke yesterday below the 1D MA50 (blue trend-line) for the first time since May 25, ringing the first bearish bell. The second could come
-
NZDUSD Time to turn bullish again.
- July 7, 2022
- Posted by: Tradingshot Articles
- Category: Forex
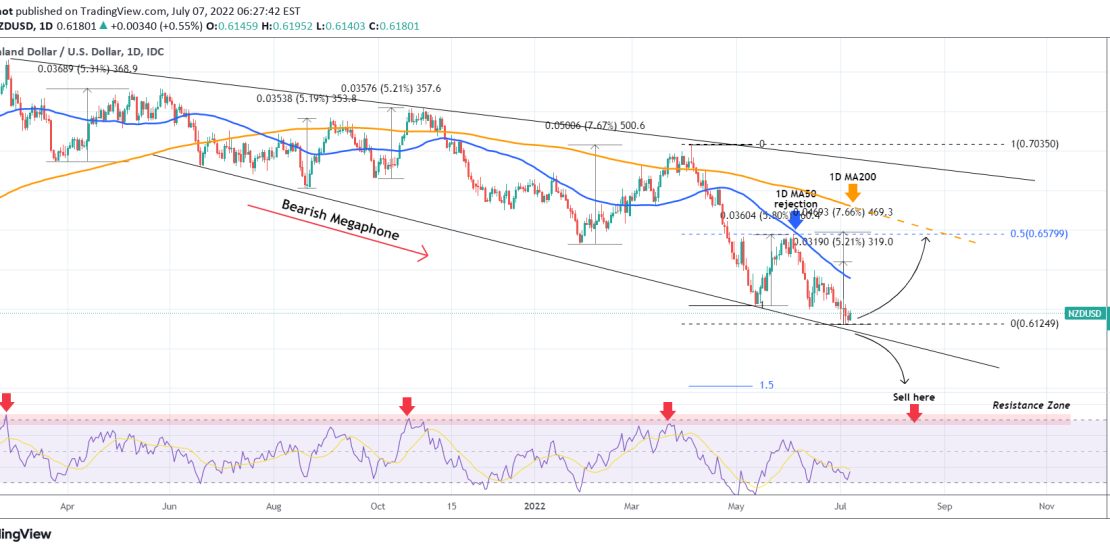
The NZDUSD pair hit our target of the last analysis we published following the +5.20% pattern: That High was in fact formed and rejected on the 1D MA50 (blue trend-line), which has been unbroken since April 14. Technically, the price still trades within the long-term Bearish Megaphone pattern, so highs are best viewed as
-
XAUUSD could be on the brink of collapse.
- July 1, 2022
- Posted by: Tradingshot Articles
- Category: Commodities
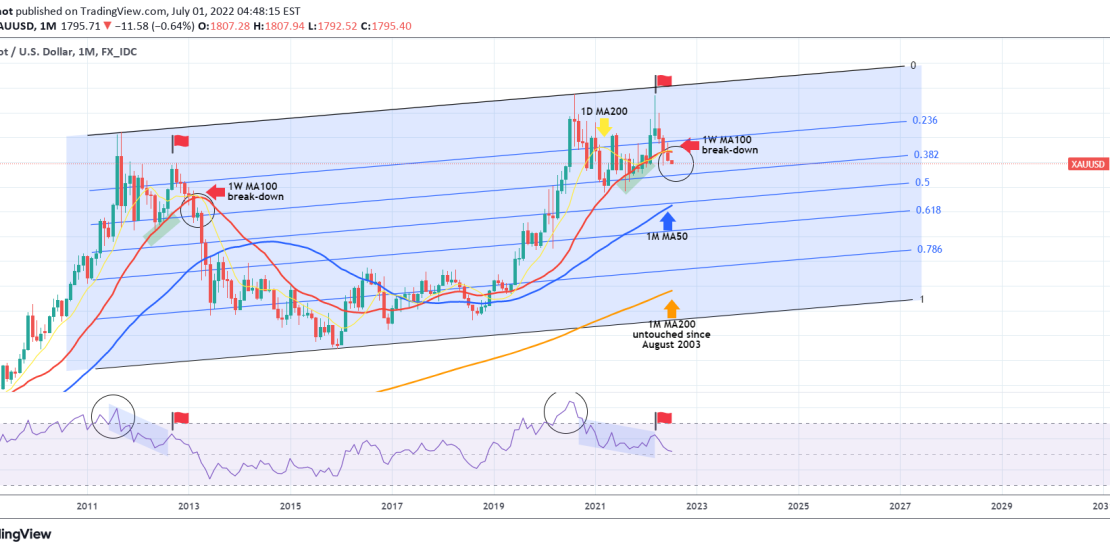
This is a chart that no-one in the Gold (XAUUSD) market (or as a matter of fact in the metals market) wants to see fulfilled as the 1M (monthly) time-frame presents a devastating scenario for the next 1 year at least. As you see this is based on a fractal taken from Gold’s previous
-
US10Y Testing the 1D MA50 again
- June 30, 2022
- Posted by: Tradingshot Articles
- Category: Other
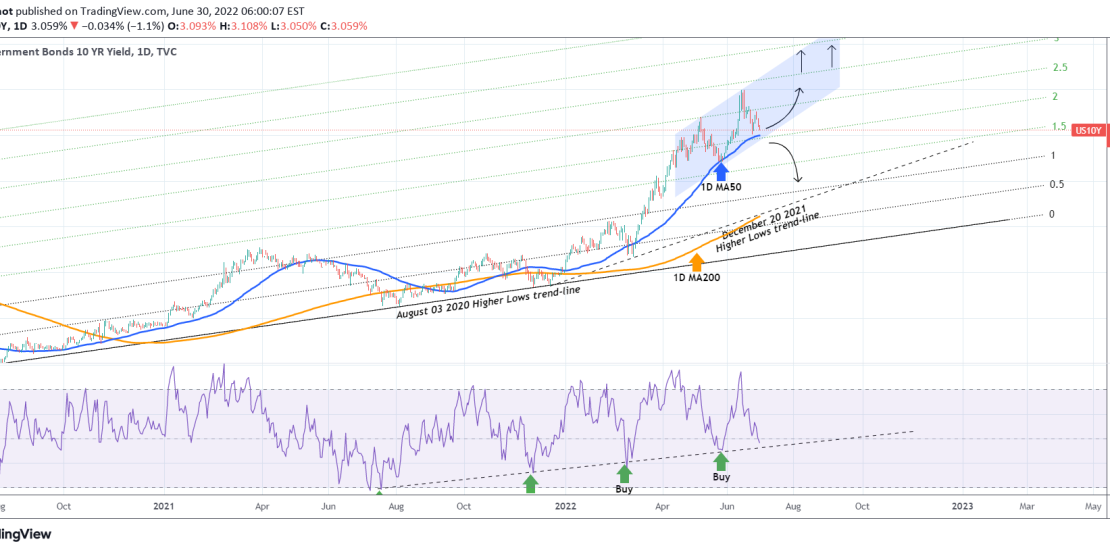
The U.S. Government Bonds 10 YR Yield (US10Y) has been on a pull-back in the past 2 weeks and is close to testing the 1D MA50 (blue trend-line) again. This held last time upon contact on May 26 and constitutes the first Support. We may have a Channel Up pattern in formation and the
-
USDSEK Still bullish long-term
- June 29, 2022
- Posted by: Tradingshot Articles
- Category: Forex
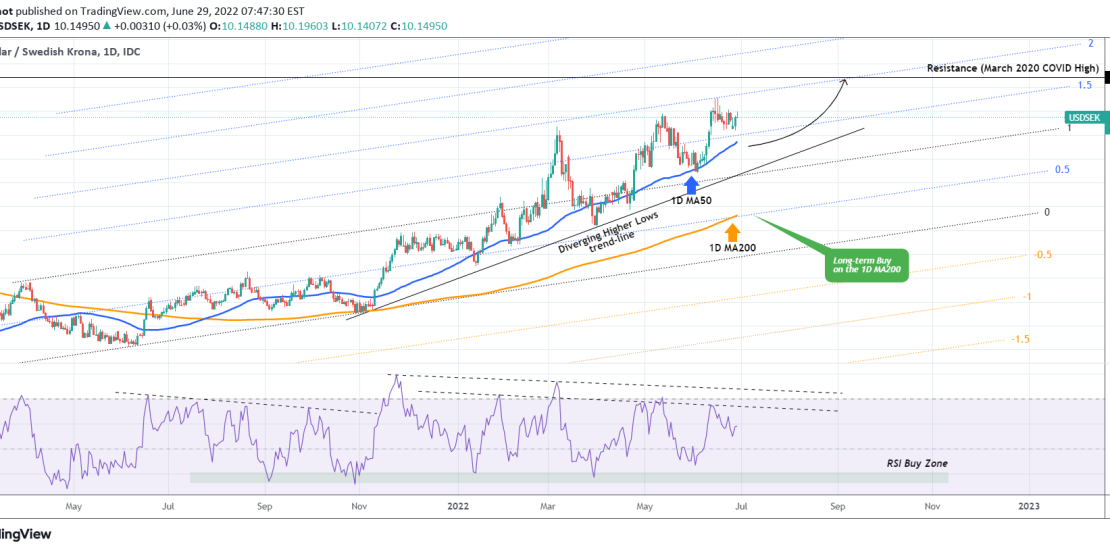
The USDSEK pair had an excellent technical bounce on the 1D MA50 (blue trend-line) following our previous analysis: As you see that was our 1st suggested buy entry, so if you took the trade you can book (partial) profits and enter on the next pull-back near the diverging Higher Lows trend-line. The long-term entry
-
DOW JONES rejected before the 1D MA50. Double Bottom possible.
- June 29, 2022
- Posted by: Tradingshot Articles
- Category: Stock Indices
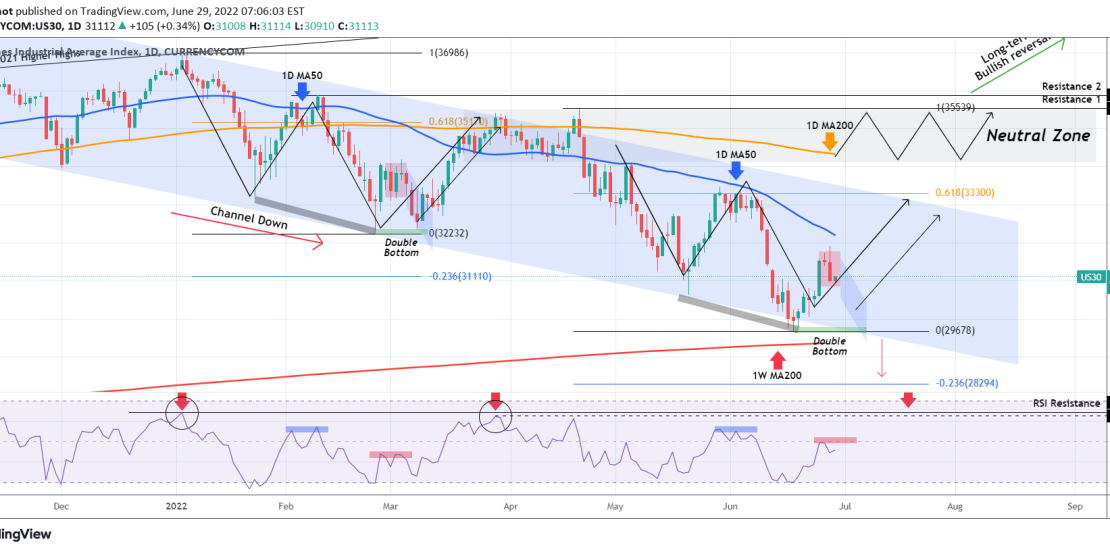
The Dow Jones index (DJI) has had a strong red 1D candle yesterday right before attempting a test of the 1D MA50 (blue trend-line), which is the short-term Resistance. As you see the long-term pattern has been a Channel Down since the January 05 high. This formation has enabled us to accurately identify and
-
KAVAUSD Approaching the 1D MA50. Attention.
- June 28, 2022
- Posted by: Tradingshot Articles
- Category: Cryptocurrency
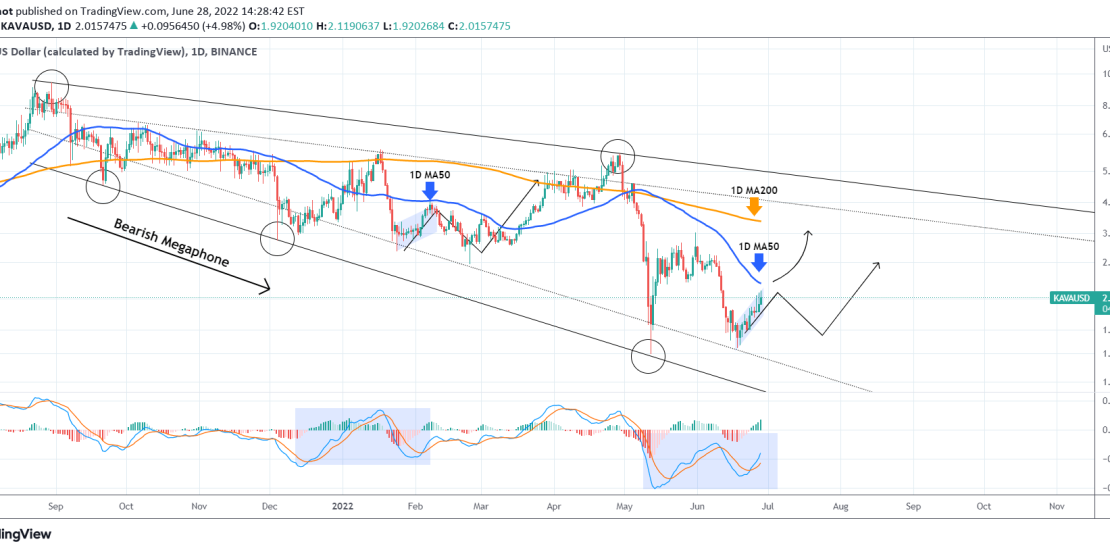
Kava (KAVAUSD) has been trading within a Bearish Megaphone since the August 30 2021 High. The recent short-term rally in the form of a Channel Up is close to a 1D MA50 (blue trend-line) test. A candle closing above it should be a bullish break-out call towards the 1D MA200 (orange trend-line). The pattern