- October 28, 2021
- Posted by: Tradingshot Articles
- Category: Commodities

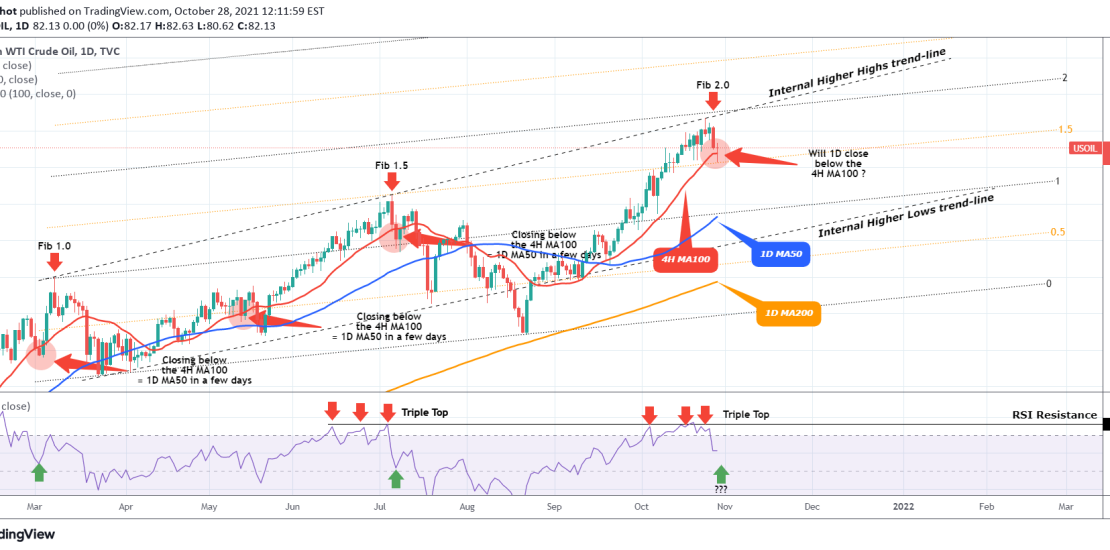
Even though my firms thesis has been very bullish on WTI Oil long-term throughout the whole year, that doesn’t stop me from spotting potential medium-term tops and technical corrections that only serve for sustaining the uptrend on the long-term. An example was my following idea on October 19:
So far it appears that the price was indeed rejected on the Internal Higher Highs trend-line and is pulling-back on a potential technical correction towards at least the 1D MA50 (blue trend-line). However, further confirmation of this potential reversal can come if the price closes a day below the 4H MA100 (red trend-line). What’s the importance of the 4H MA100? Well for the whole year, this has been the short-term support during WTI uptrends and every time a session closed below it, then the 1D MA50 was hit a few days later.
Important notice: Such a confirmation was also given by another indicator, the RSI, last time for the formation of the peak on the Fib 2.0 (as seen I’ve plotted the long-term uptrend on the Fibonacci Channel). The RSI made a Triple Top on the exact same Resistance that gave the July 06 peak on Fib 1.5. Keep an eye on such confirmations, they come quite useful when determining reversals that are hard to see coming when the price is on a trend.
Tradingview link:


