2021 June
-
COSTCO Strong buy opportunity on a 2-year old fractal
- June 29, 2021
- Posted by: Tradingshot Articles
- Category: Uncategorized
No Comments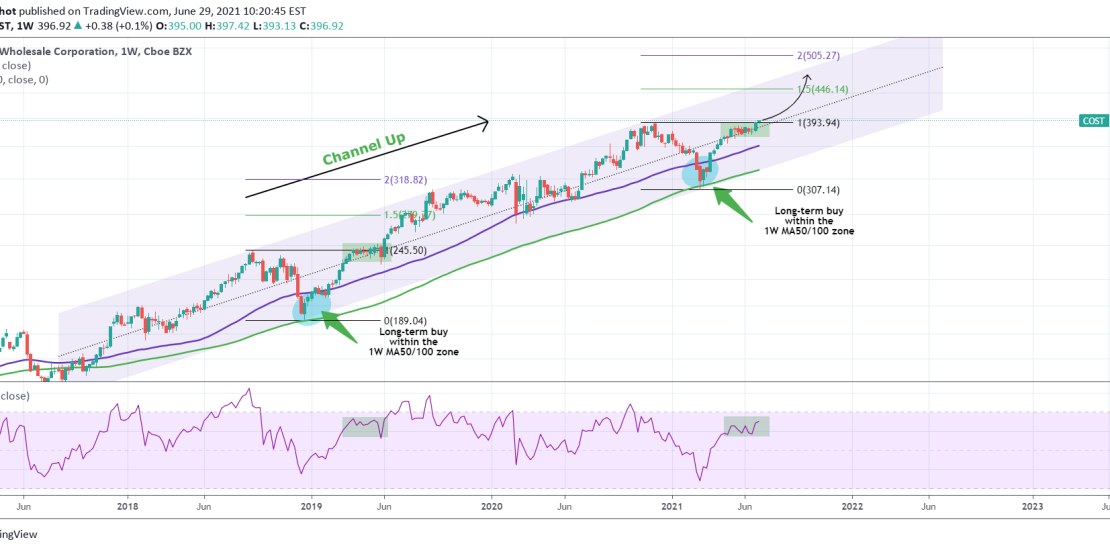
Pattern: Channel Up on 1W. Signal: Buy as the price broke above its Resistance (and November 2020 High), in a similar sequence as the April-May 2019 fractal. Even the RSI sequences are identical indicating that the price is breaking outside of this consolidation pattern. Target: Within the 1.5 – 2.0 Fibonacci extension zone (as
-
S&P500 March/ April fractal points to above 4450
- June 28, 2021
- Posted by: Tradingshot Articles
- Category: Stock Indices
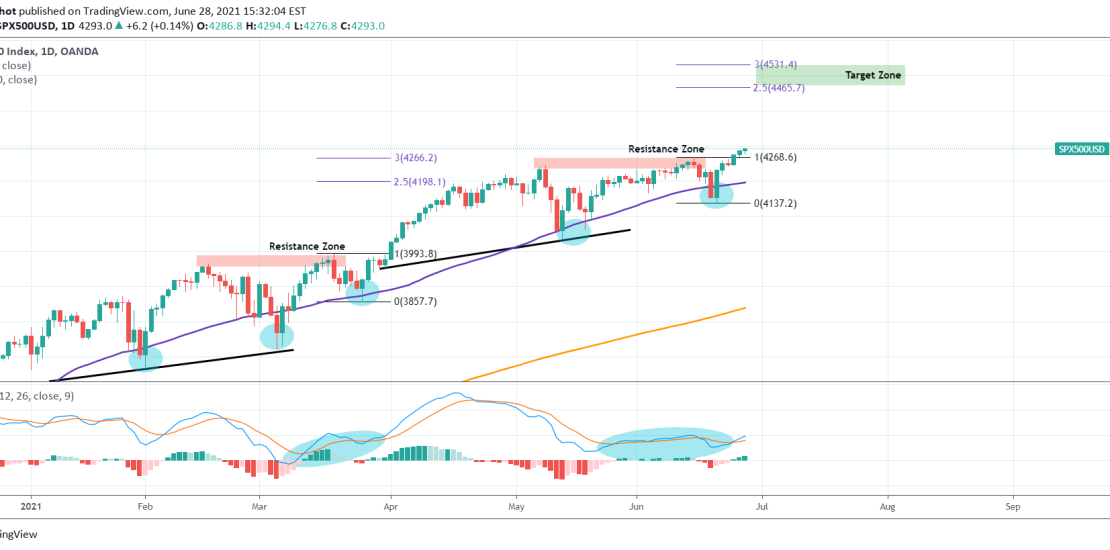
This is something I’ve also pointed out a month ago but after last week’s rebound on the 1D MA50 (blue trend-line) it got even clearer. S&P seems to be replicating the March/ April fractal where after a break-out above the Resistance Zone (on a 1D MA50 rebound), the price rallied to a level within
-
WTI OIL Channel Up rejection shows strong pull-back next
- June 28, 2021
- Posted by: Tradingshot Articles
- Category: Commodities
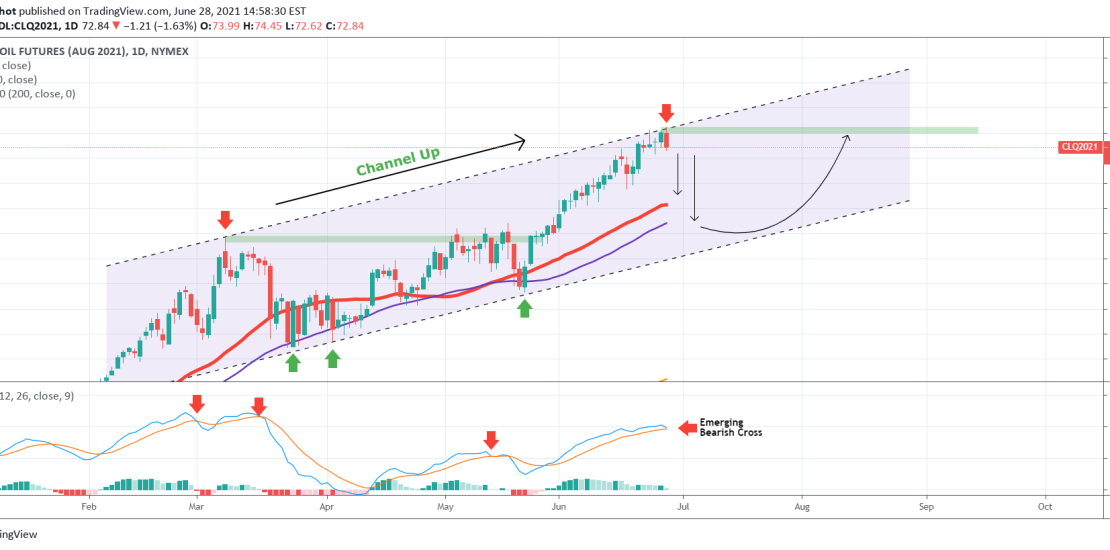
Pattern: Channel Up on 1D. Signal: Sell as the price got rejected on the Higher Highs trend-line of the Channel Up. This will be confirmed once the 1D MACD makes a Bearish Cross. Target: The 4H MA200 initially (red trend-line) and the 1D MA50 (blue trend-line) in extension where yuo can shift to a
-
USDBRL Is this an early Buy Signal for Coffee?
- June 28, 2021
- Posted by: Tradingshot Articles
- Category: Forex
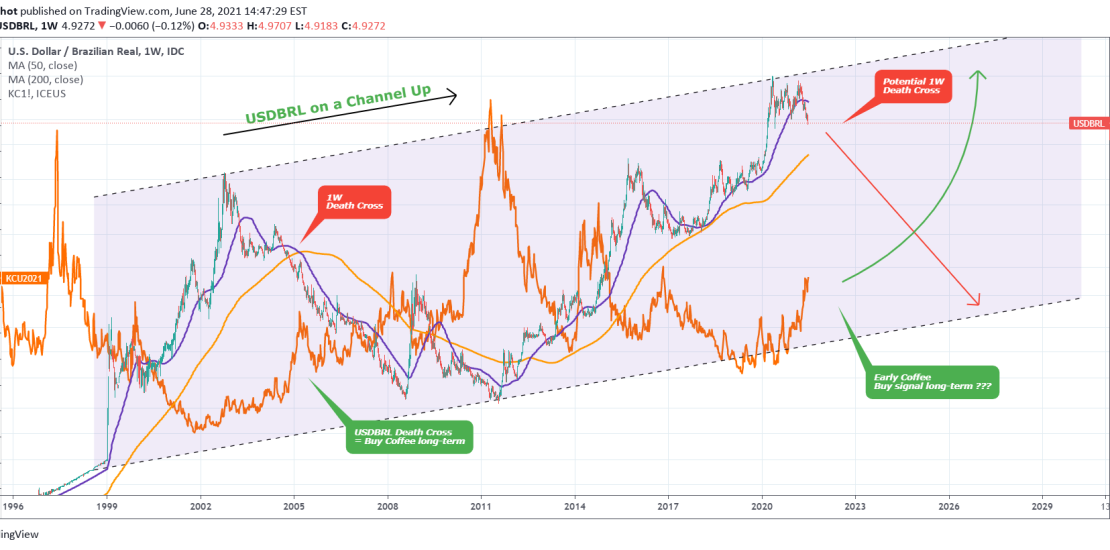
The USDBRL pair has been trading within a steady 2-decade long Channel Up, which is well displayed on this 1W chart. As you see last time it formed a 1W Death Cross (MA50 crossing below the MA200) after a Higher High, it dropped significantly and that was still a fairly early buy signal on
-
BITCOIN Is miner profitability on all time lows a buy signal?
- June 28, 2021
- Posted by: Tradingshot Articles
- Category: Cryptocurrency
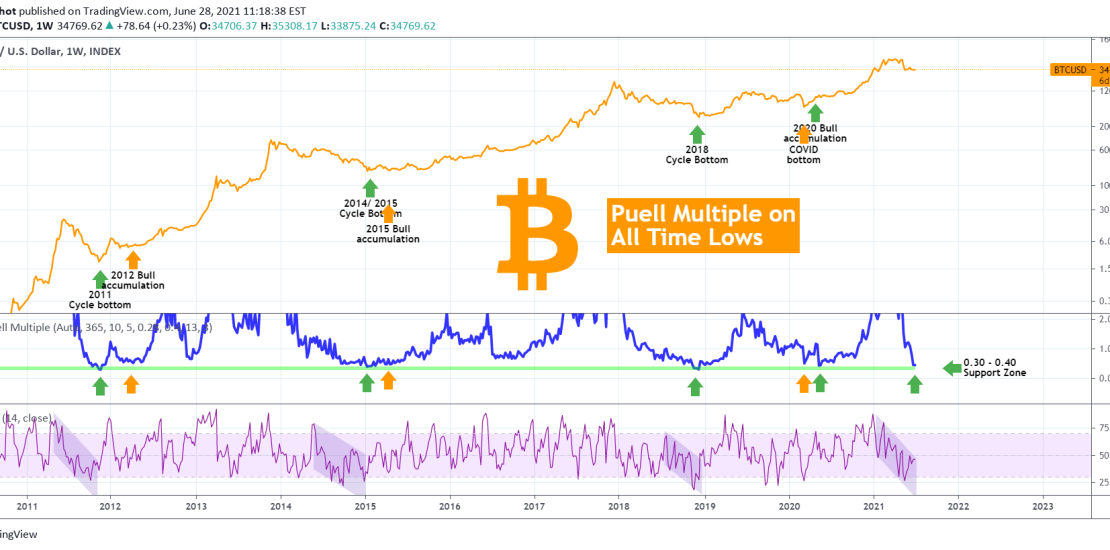
Puell’s Multiple is an indicator that measures miners’ profitability. I’ve set this up on the 1W chart and as you see it is on an all time low range, the 0.30 – 0.40 Support Zone. Every time since the genesis that this metric hit that zone (or came very close to it), Bitcoin was
-
DOW JONES Is this a giant Bullish Flag?
- June 23, 2021
- Posted by: Tradingshot Articles
- Category: Stock Indices
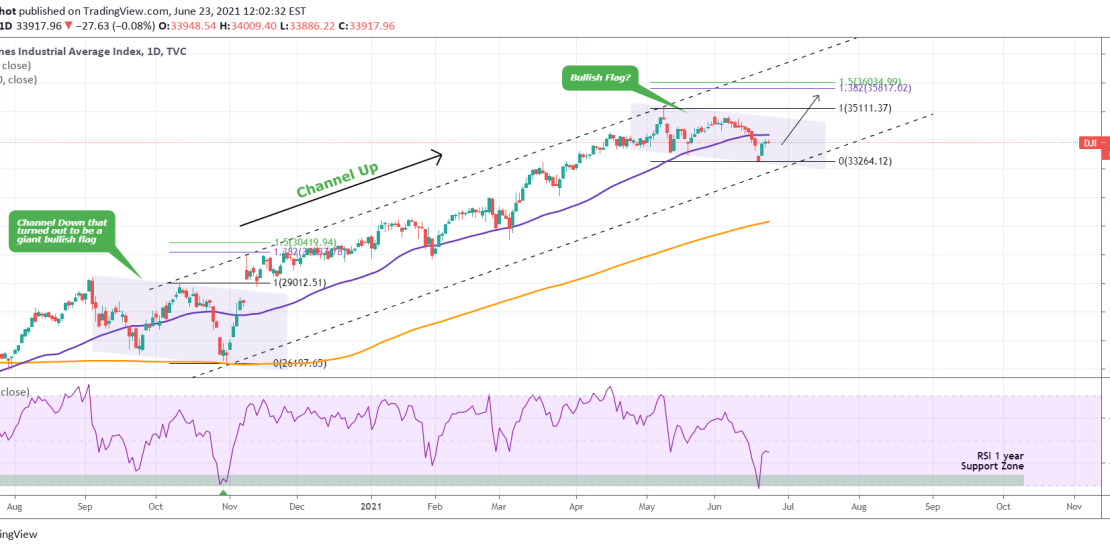
DJIA has been trading within a Channel Up since the U.S. elections last November. However since the May 10 Top, it has been trading under Lower Highs and Lower Lows which are the characteristics of a Channel Down. Last time we had such pattern was the sequence before the U.S. elections, which turned out
-
BITCOIN Will this move be a historic first?
- June 20, 2021
- Posted by: Tradingshot Articles
- Category: Cryptocurrency
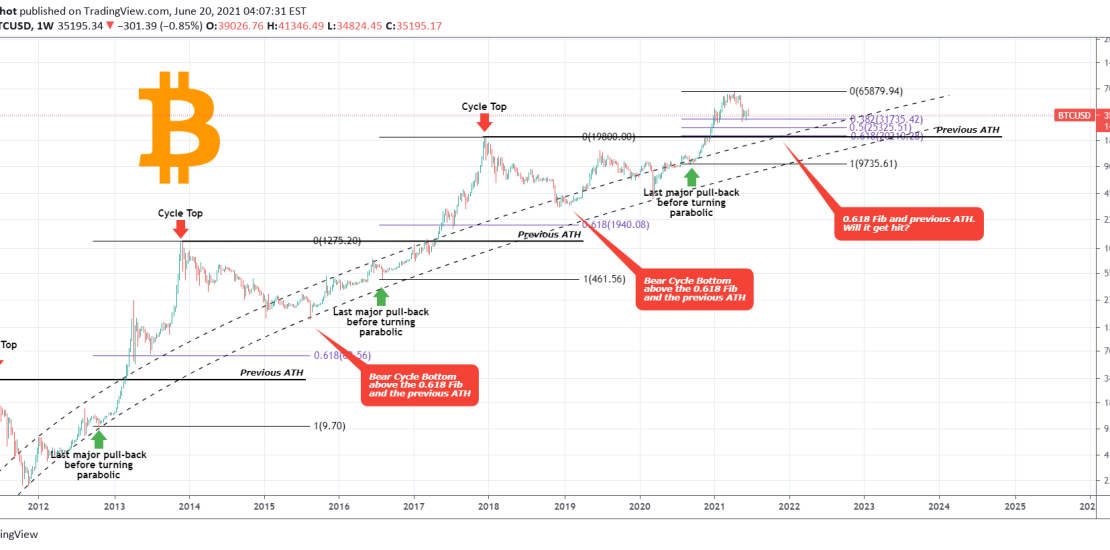
This is BTC on the 1W time-frame in order to get all of its historic price action on one chart as I’ll be looking at each Cycle on a Fib approach. As you see each time Bitcoin made a Bull Cycle Top (red arrow) the subsequent Bear Cycle that followed never reached as low
-
BITCOIN and VIX. Volatility Spike = BTC Bear Market?
- June 18, 2021
- Posted by: Tradingshot Articles
- Category: Uncategorized
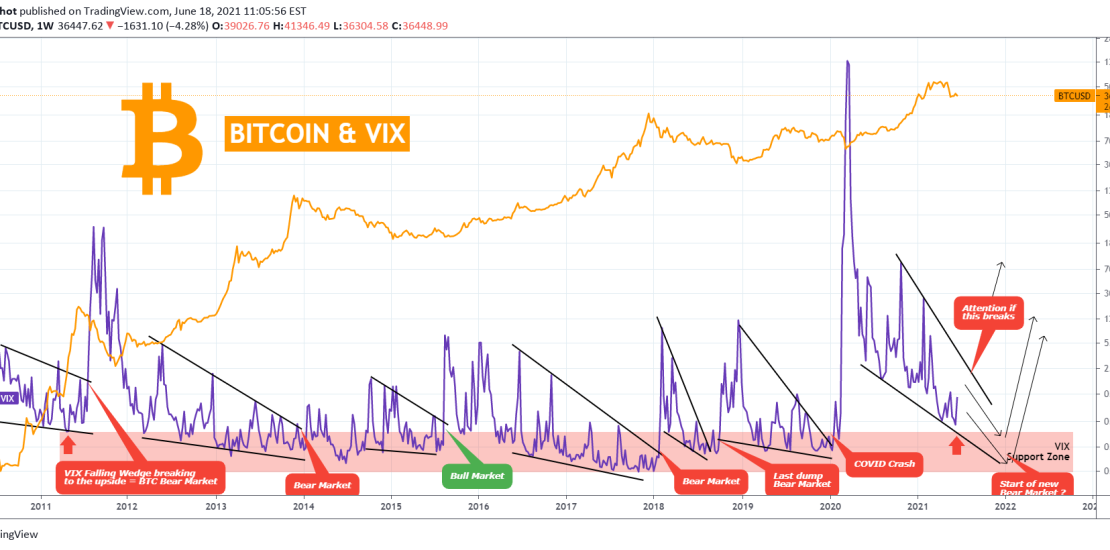
-
DXY The 1W MA50 holds the key.
- June 18, 2021
- Posted by: Tradingshot Articles
- Category: Forex
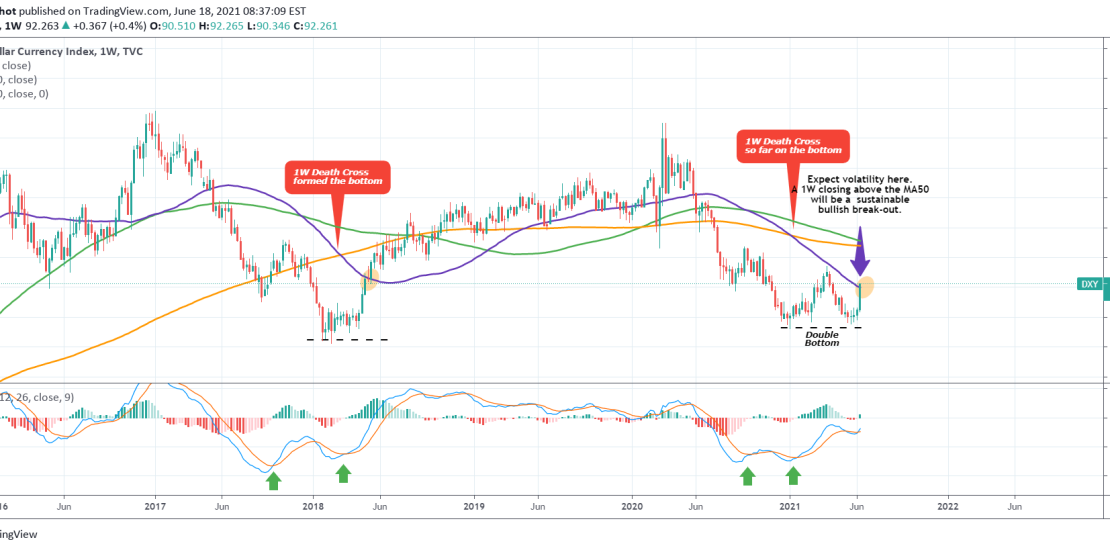
On the first quarter of the year, I’ve published the following posts. One was a research on DXY’s tendency to 3 year cycles and how it has entered a new one, and the other how under certain circumstances, the current bottom resembles that of 2018: It appears that the U.S. Dollar Index is
-
US10Y Strong rejection on the 1D MA50. Long-term bearish sign?
- June 17, 2021
- Posted by: Tradingshot Articles
- Category: Uncategorized
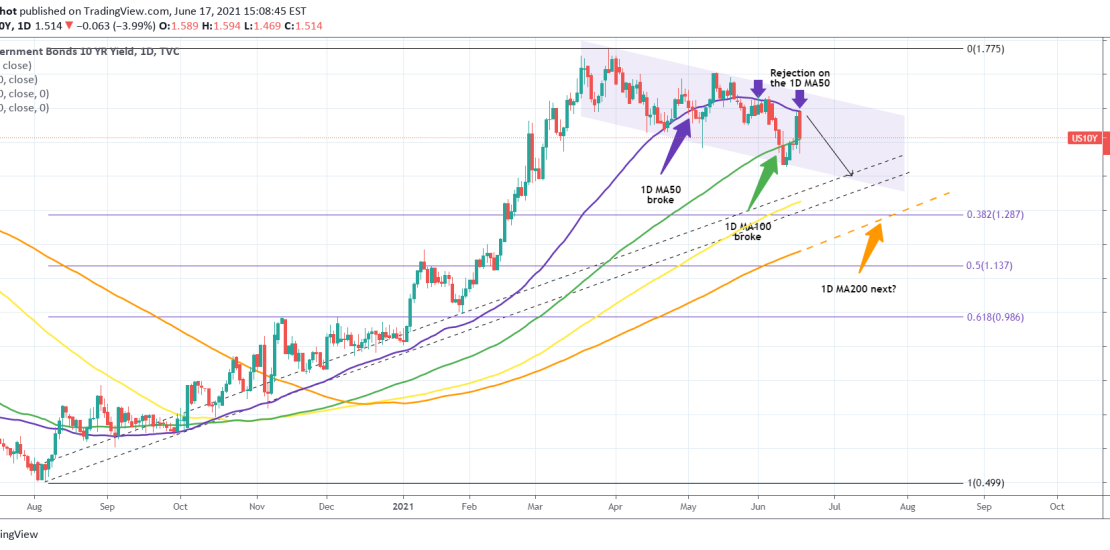
A perfect Channel Down has been formed for the US10Y on the 1D time-frame. The 1D MA50 and 1D MA100 have already been broken. The 1D MA150 (yellow trend-line) is exactly within the Higher Lows Zone from the very bottom of August 2020. Will the 1D MA200 (orange trend-line) get tested right on the
- 1
- 2

