- June 28, 2021
- Posted by: Tradingshot Articles
- Category: Cryptocurrency

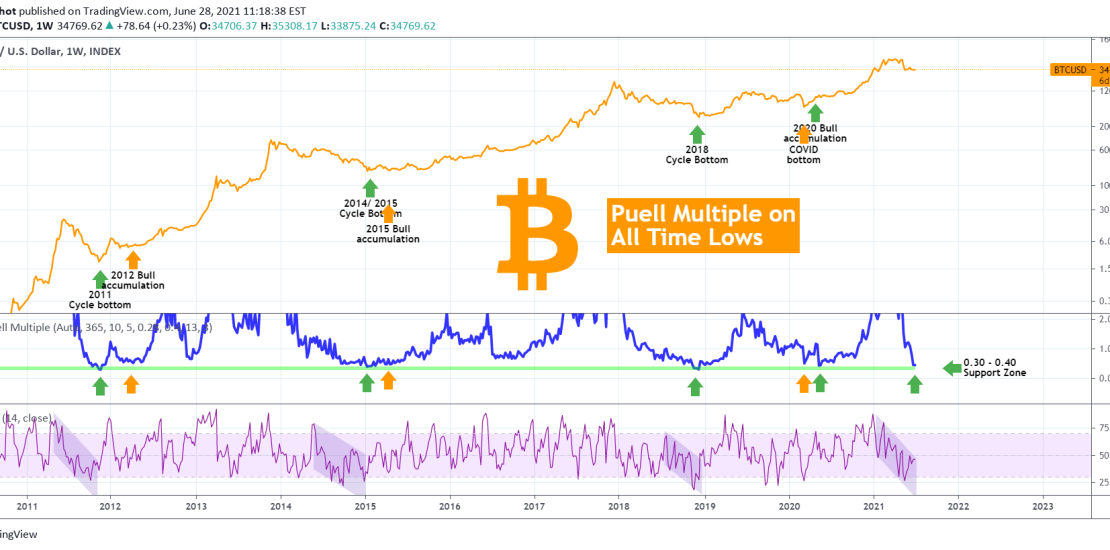
Puell’s Multiple is an indicator that measures miners’ profitability. I’ve set this up on the 1W chart and as you see it is on an all time low range, the 0.30 – 0.40 Support Zone. Every time since the genesis that this metric hit that zone (or came very close to it), Bitcoin was either making a Bear Cycle Bottom or a Bull accumulation before a major rally began.
To make this more interesting, I’ve plotted the RSI also but on the 1D scale. This shows that, with the exception of the COVID 2020 bottom, every time the 1D RIS hit or broke the 30.000 level within a Channel Down while the Puell Multiple was in its All Time Low Zone, it was a bottom and a major rally was in the making.
What do you think will happen this time? Feel free to share your work and let me know in the comments section!
Tradingview link:

