

2020
-
EURUSD Pull back possible on Bearish MACD Cross
- December 4, 2020
- Posted by: Tradingshot Articles
- Category: Forex
No Comments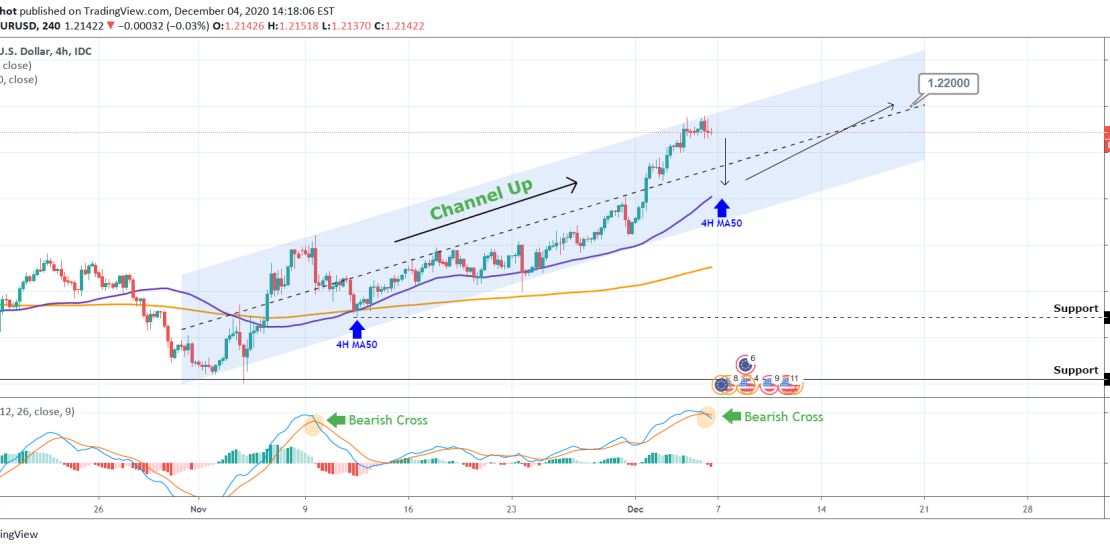
Pattern: Channel Up on 4H. Signal: Sell towards the 4H MA50, as the MACD made a Bearish Cross almost exactly where it made its November 09 Cross. Buy once contact is made. Target: 1.2200. ** Please support this idea with your likes and comments, it is the best way to keep it relevant and
-
BITCOIN Testing the ATH with Production Cost near. Sign for 50k?
- December 4, 2020
- Posted by: Tradingshot Articles
- Category: Cryptocurrency
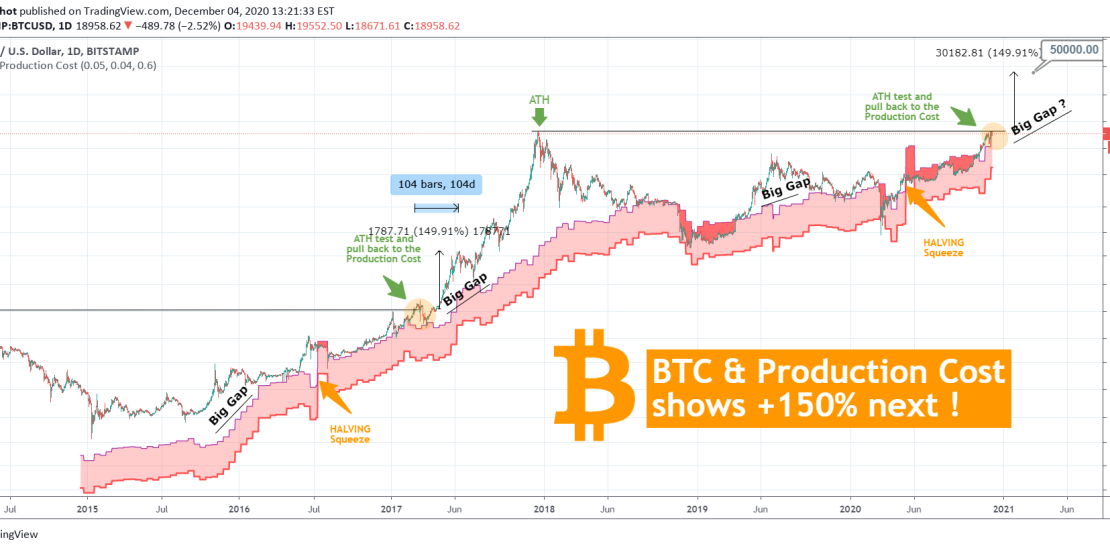
Bitcoin has been consolidating since December 01 when it touched the All Time High (19900 of Dec 2017). On any other occasions, consolidation on such a key Resistance level would be a sign of struggle, hence a bearish signal. However in this study I examine why this may not be the case based on
-
XAUUUSD Why testing the 4H MA50 as Support is important!
- December 3, 2020
- Posted by: Tradingshot Articles
- Category: Commodities
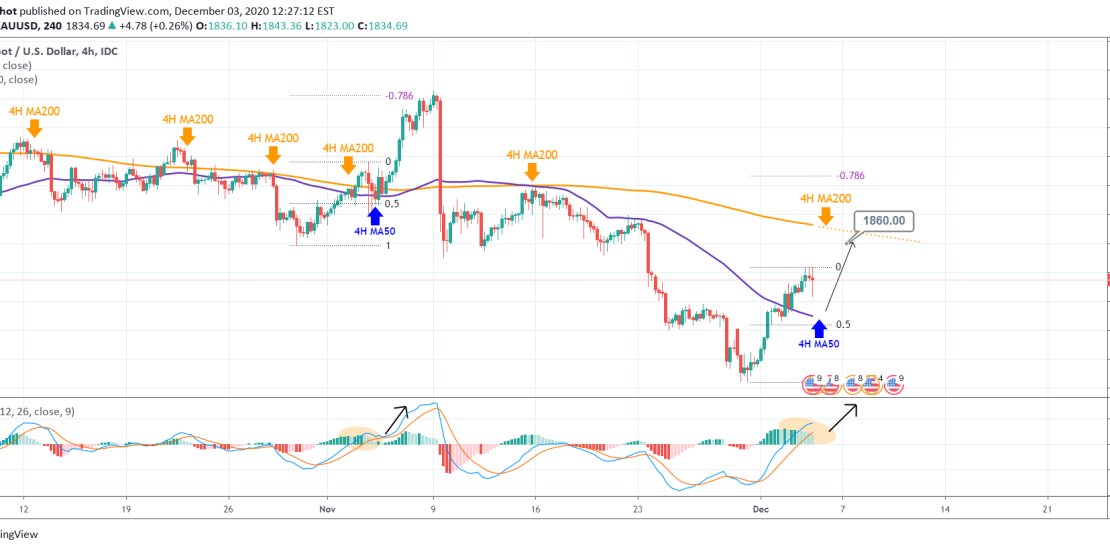
This is a quick update on Gold. The price broke above the 4H MA50 with relative ease and this bullish leg (since November 30) resembles the sequence of October 29 – November 09. That wave, after a pull back to its 0.5 Fibonacci retracement level and the 4H MA50, it found Support and rebounded
-
EURUSD Bullish set-up
- December 2, 2020
- Posted by: Tradingshot Articles
- Category: Forex
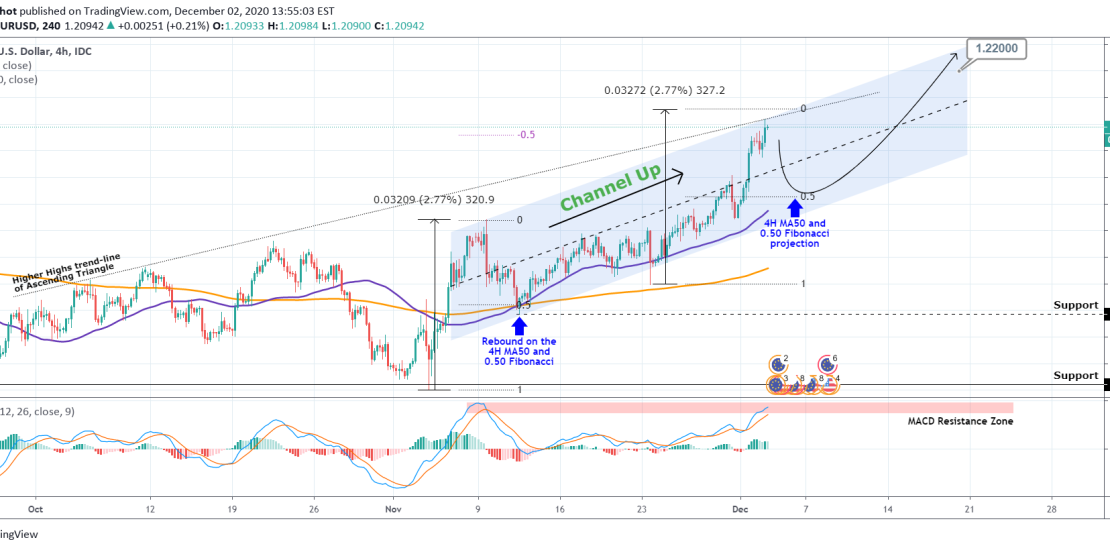
Last time I showed why EURUSD was bullish both on the 1D time-frame (targets were 1.1900 and 1.2000) but perhaps more importantly on the 1W time-frame where the post March 2020 price action resembles that of the 2017 rise: Right now I focus on the 4H chart, where despite of the wider (rough) Ascending
-
XAUUSD Still bullish but hit the 4H MA50. Short-term scenarios.
- December 1, 2020
- Posted by: Tradingshot Articles
- Category: Commodities
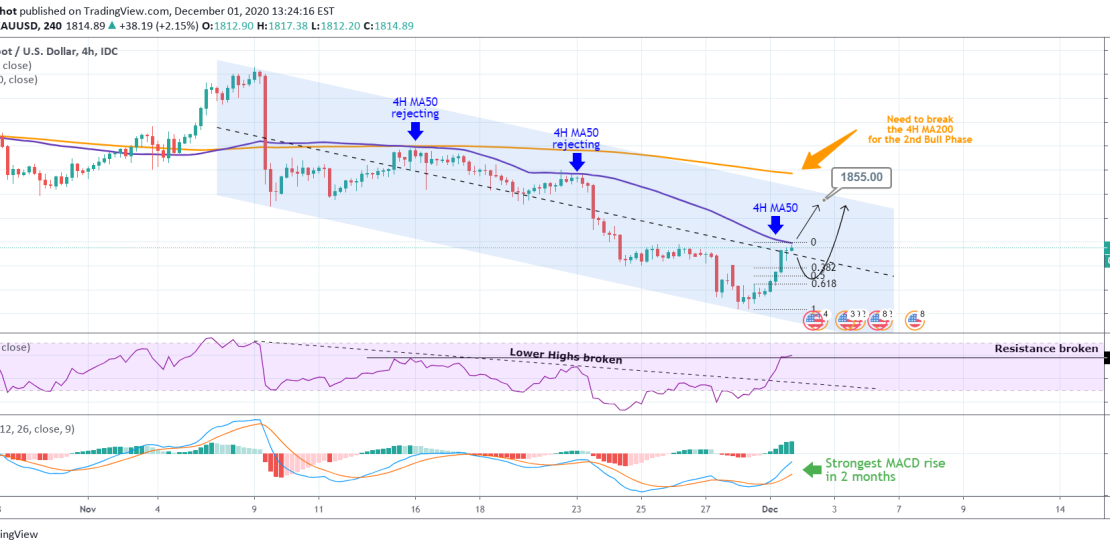
Yesterday I posted a long-term projection on Gold, which had to do with the importance of holding the 1W MA50. And so far buyers have defended this long-term Support: Today’s rise has been strong, indicating a powerful buying accumulation but that doesn’t mean that shorter-term traders shouldn’t be on their toes. The reason is
-
WTI OIL Trading Plan
- November 22, 2020
- Posted by: Tradingshot Articles
- Category: Commodities
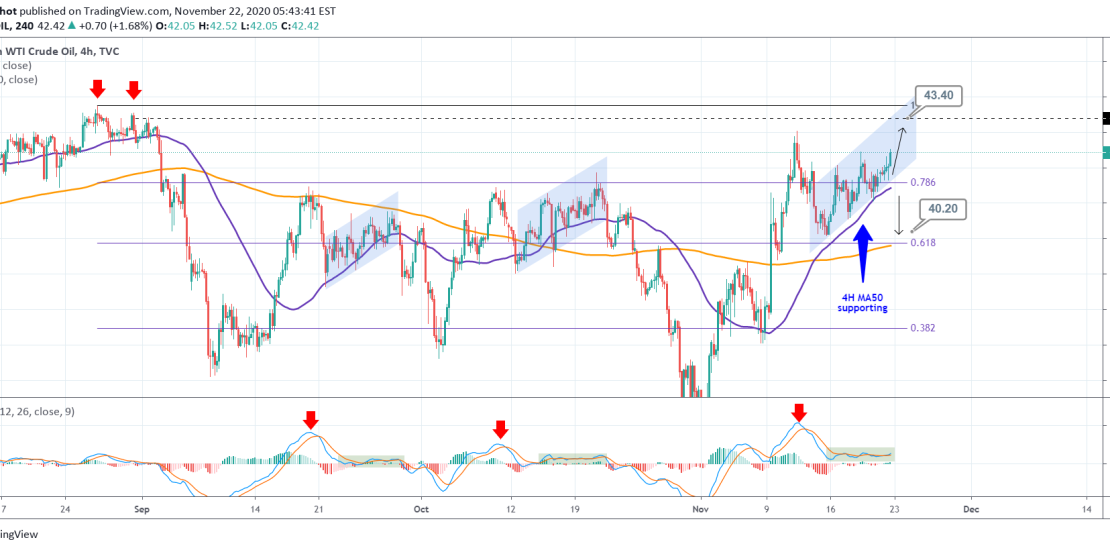
Pattern: Channel Up on 4H. Signal: (A) Buy as long as the 4H MA50 is supporting, (B) Sell if it breaks. Target: (A) 43.40 (September 01 High), (B) 40.20 (just above the 4H MA200). ** Please support this idea with your likes and comments, it is the best way to keep it relevant and
-
S&P500 Trading Plan
- November 22, 2020
- Posted by: Tradingshot Articles
- Category: Stock Indices
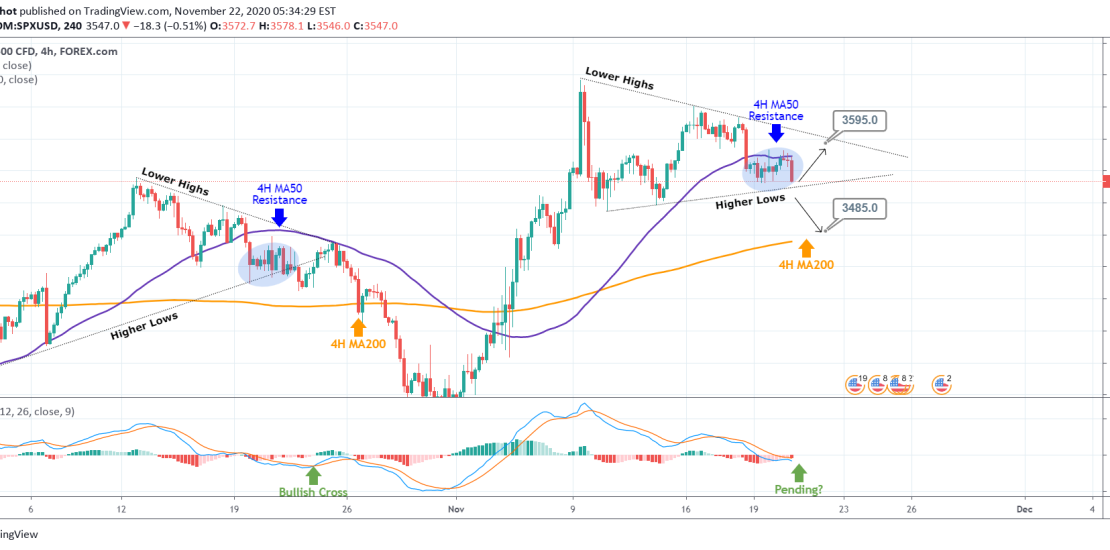
Pattern: Triangle on 4H. Signal: (A) Buy as long as the Higher Lows trend-line holds, (B) Sell if it breaks. Target: (A) 3595 (just below the Lower Highs), (B) 3485 (just above the 4H MA200). ** Please support this idea with your likes and comments, it is the best way to keep it relevant
-
Is this the start of the parabolic run for LITECOIN?
- November 20, 2020
- Posted by: Tradingshot Articles
- Category: Cryptocurrency
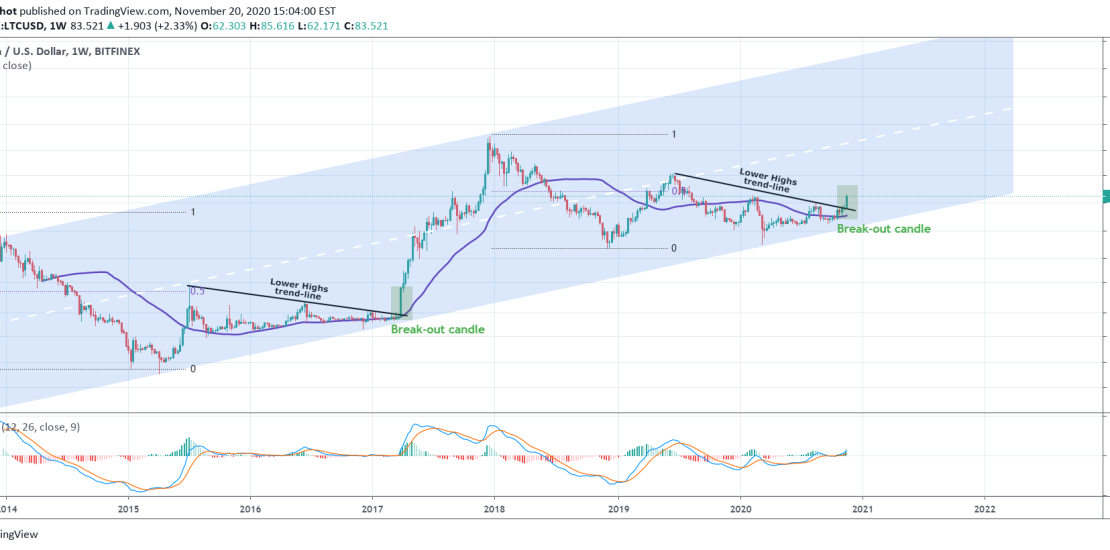
This is a simple comparison on LTCUSD of the current cycle with the previous. As seen on the chart, on March 2017, Litecoin broke above the accumulation sequence that was contained under a Lower Highs trend-line and that 1W candle was what kick-started its parabolic Bull Run. Right now the situation is exactly the
-
Can the market rise more during Biden’s Presidency than Trump’s?
- November 16, 2020
- Posted by: Tradingshot Articles
- Category: Stock Indices
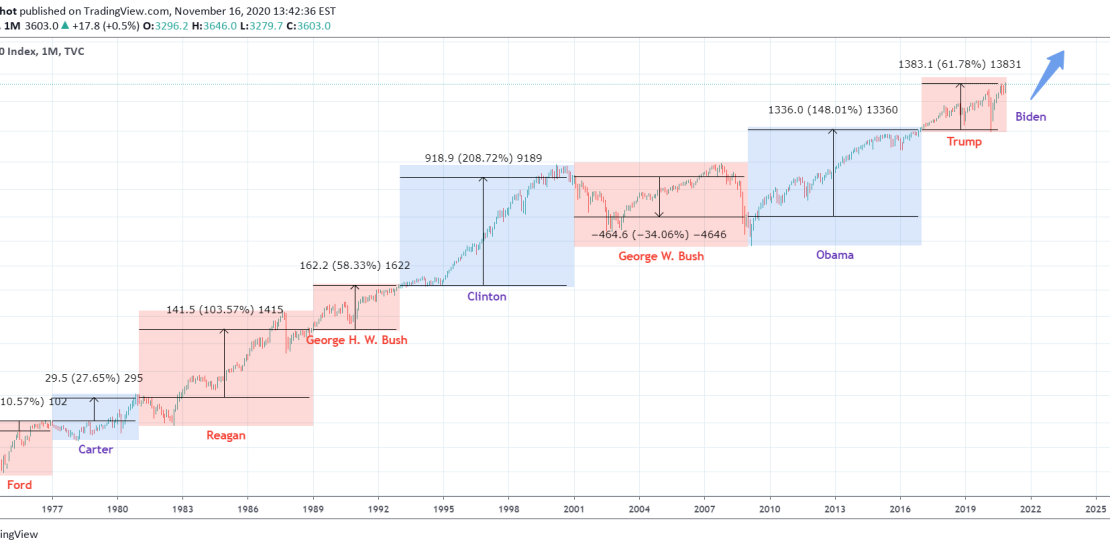
This is a simple chart showing the performance of the S&P500 under each President since the Ford administration is 1974. As you see contrary to popular belief, the stock market in modern times has done (much) better under a Democrat President. Bill Clinton has had the strongest performance with more than +200% in gains
-
S&P500 Buy Signal / Strong supporting line
- November 11, 2020
- Posted by: Tradingshot Articles
- Category: Stock Indices
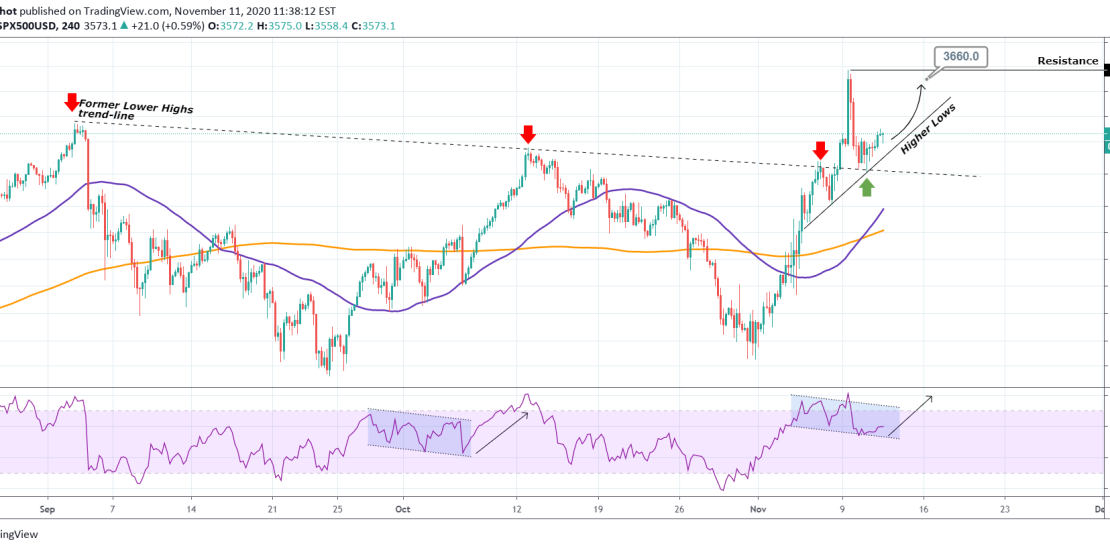
Pattern: Higher Lows on the 4H chart. Signal: Buy as the index rebounded not only on the former Lower Highs trend-line (dashed line), but also on the newly formed Higher Lows trend-line. Target: 3660 (just below the 3675 Resistance). Recent S&P signals: ** Please support this idea with your likes and comments, it