- December 3, 2020
- Posted by: Tradingshot Articles
- Category: Commodities

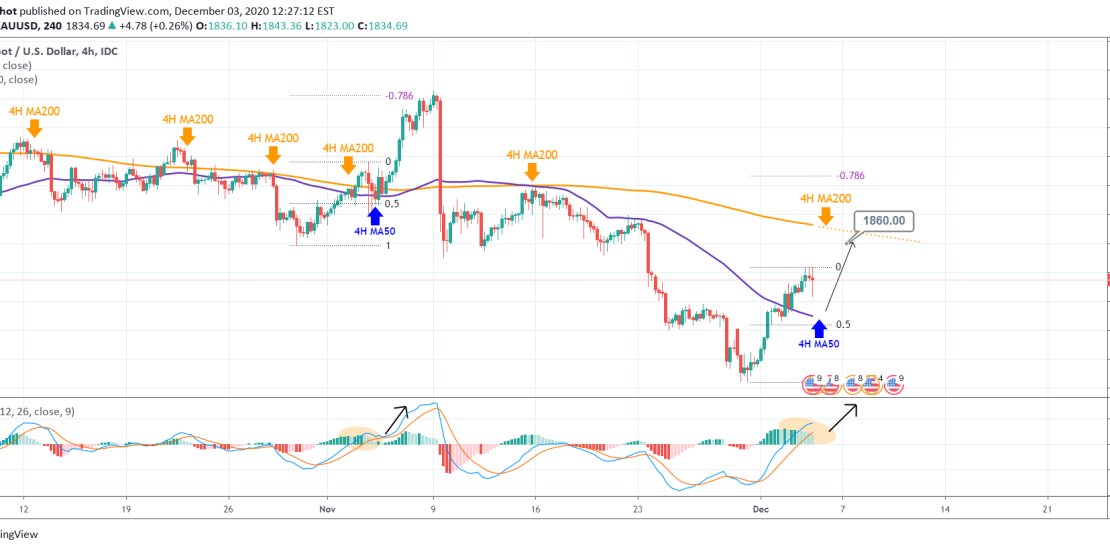
This is a quick update on Gold. The price broke above the 4H MA50 with relative ease and this bullish leg (since November 30) resembles the sequence of October 29 – November 09. That wave, after a pull back to its 0.5 Fibonacci retracement level and the 4H MA50, it found Support and rebounded to the -0.786 Fibonacci extension.
That extension is at 1905 but I believe we should first keep our eyes on the 4H MA200, which shows a projected contact just above 1860. Why the 4H MA200 is important? Because it last rejected the price on November 15 and excluding the November 04 – 09 rise, which was caused by the U.S. elections, every time since September 03 Gold touched or marginally broke the 4H MA200, it got rejected.
As a sidenote, see why those sequences are similar even on the 1H time-frame with the formation of the Golden Cross:
** Please support this idea with your likes and comments, it is the best way to keep it relevant and support me. **
——————————————————————————————————–
!! Donations via TradingView coins also help me a great deal at posting more free trading content and signals here !!
🎉 👍 Shout-out to TradingShot’s 💰 top TradingView Coin donor 💰 this week ==> TradingView
——————————————————————————————————–
Tradingview link:

