

2020
-
EURUSD Break out Signal
- March 16, 2020
- Posted by: Tradingshot Articles
- Category: Forex
No Comments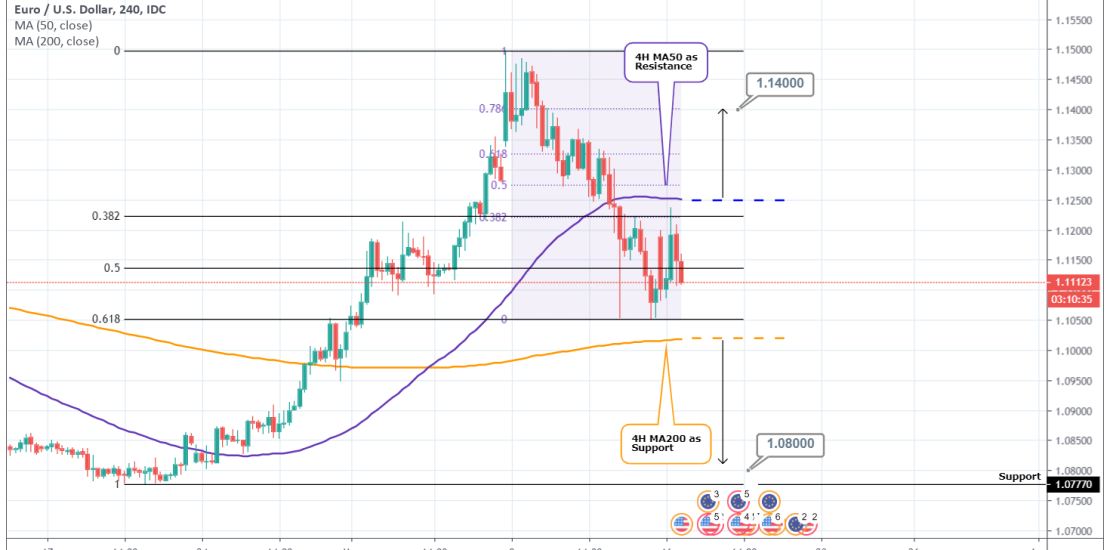
Pattern: Rectangle on 4H within the 0.382 and 0.618 Fibonacci levels. Signal: (a) Bullish if the 4H MA50 (blue) breaks, (b) Bearish if the 4H MA200 (orange) breaks. Target: (a) 1.14000 (the 0.786 Fibonacci retracement level, (b) 1.08000 (just above the the 1D Support). Tradingview link: https://www.tradingview.com/chart/EURUSD/ZD8glsca-EURUSD-Break-out-Signal
-
BITCOIN The day it became fully correlated with S&P500
- March 14, 2020
- Posted by: Tradingshot Articles
- Category: Cryptocurrency
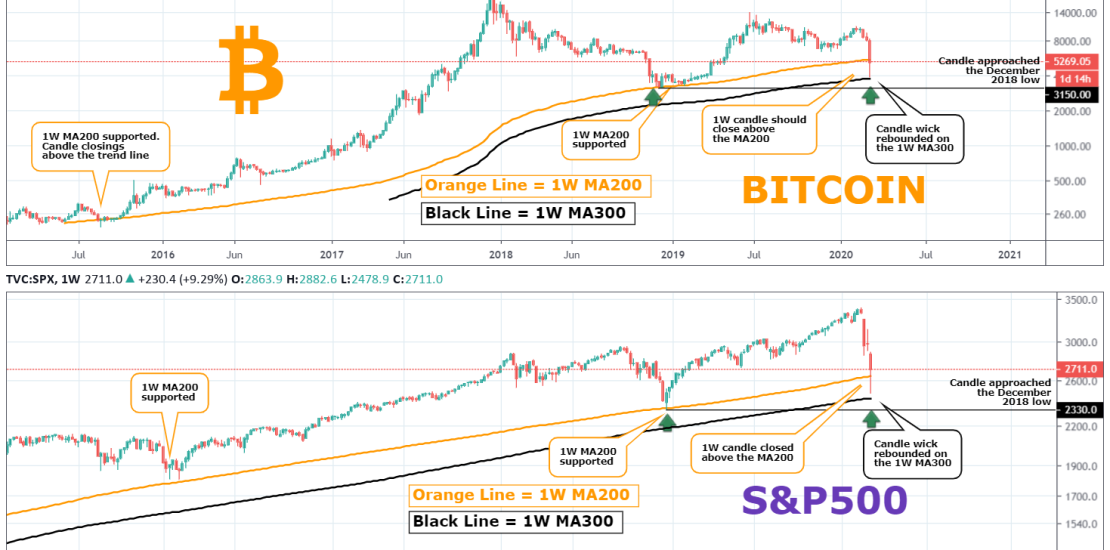
With this title you might be wondering what Bitcoin has to do with the Standard & Poor’s 500 (S&P500) stock index. You think that Bitcoin and stocks are not correlated? Think again as there is a correlation and indeed a very scary one. Basically I should rephrase the title to “The WEEK it became fully
-
LTCETH Sell Signal
- March 13, 2020
- Posted by: Tradingshot Articles
- Category: Cryptocurrency
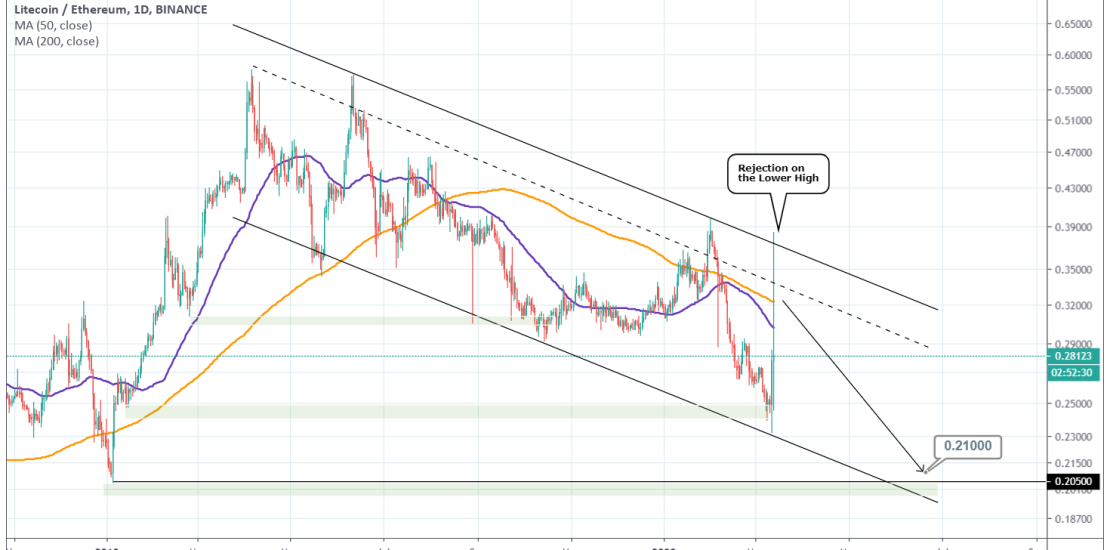
Pattern: Channel Down. Signal: Bearish as the price was rejected on the Lower High trend line of the pattern: Target: 0.2100 (right above the symmetrical Gap fill (green line)). Tradingview link: https://www.tradingview.com/chart/LTCETH/mw4oiGDn-LTCETH-Sell-Signal
-
XMRBTC Buy Signal
- March 13, 2020
- Posted by: Tradingshot Articles
- Category: Cryptocurrency
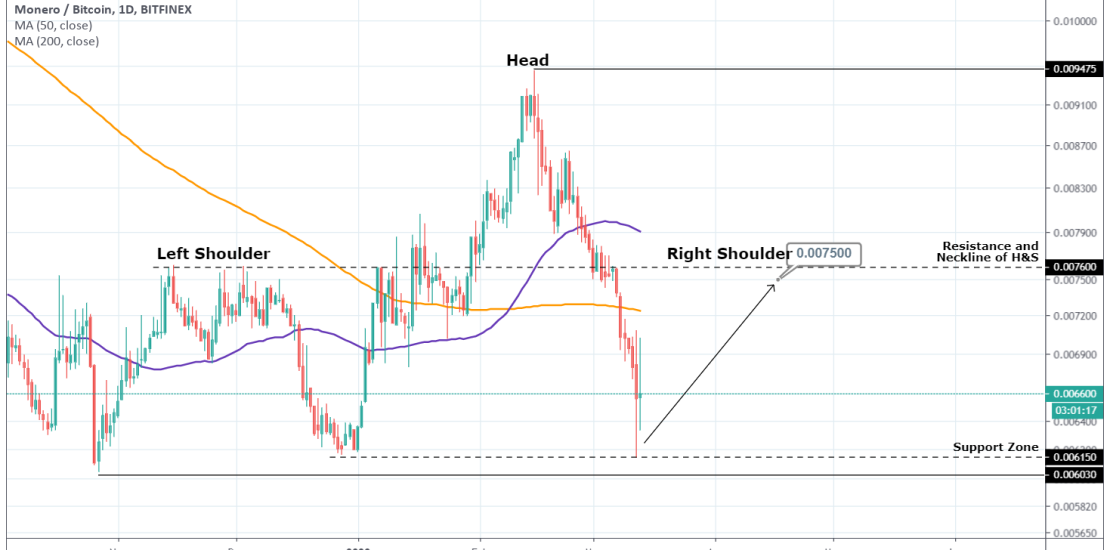
Pattern: Head and Shoulders on 1D. Signal: Bullish as the price hit the 0.006150 Support and should rebound to form the Right Shoulder. Target: 0.0075 (right below the Neckline). Tradingview link: https://www.tradingview.com/chart/XMRBTC/Samkau0J-XMRBTC-Buy-Signal
-
ETHBTC Buy Signal
- March 12, 2020
- Posted by: Tradingshot Articles
- Category: Cryptocurrency
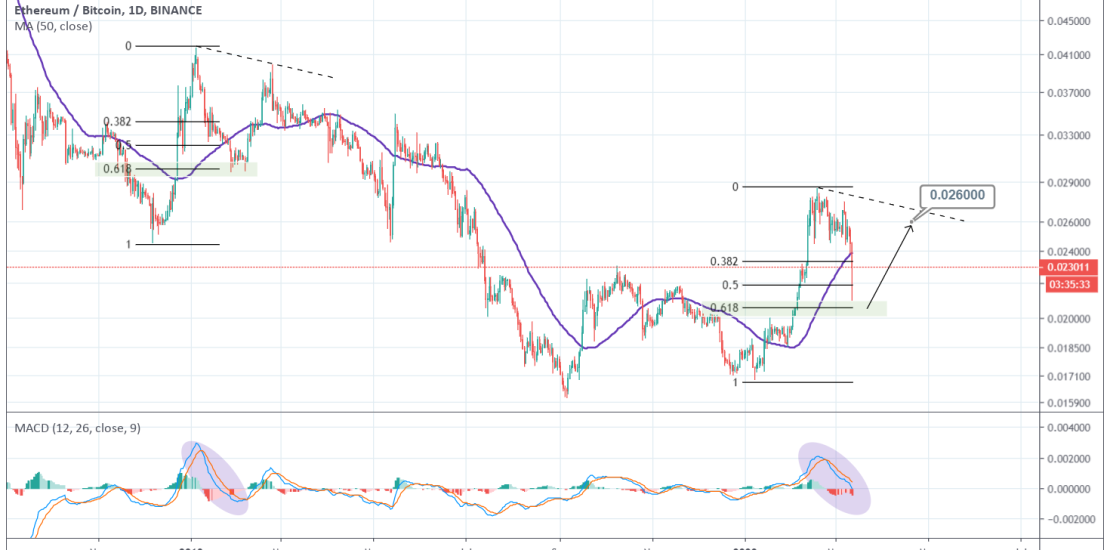
Pattern: Breakdown of parabolic rise. Signal: Bullish as the price has almost made a 0.618 Fibonacci retracement. Target: 0.02600. Tradingview link: https://www.tradingview.com/chart/ETHBTC/ZT7byJrA-ETHBTC-Buy-Signal
-
XAUUSD Sell Signal
- March 11, 2020
- Posted by: Tradingshot Articles
- Category: Commodities
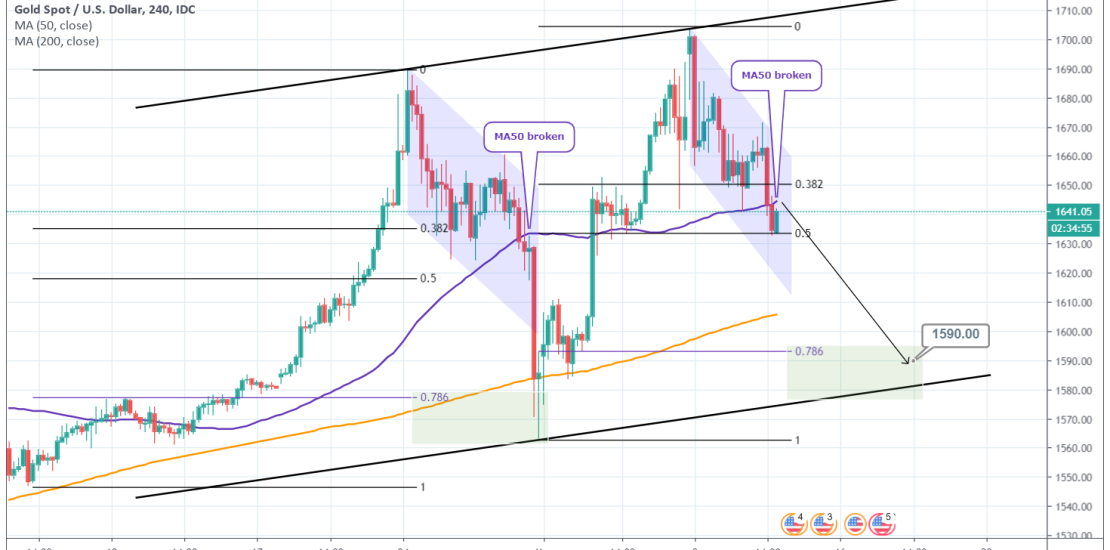
Pattern: Channel Down on 4H. Signal: Bearish as the 4H MA50 broke and that was a bearish signal last time it took place. Target: 1590 (the 0.786 Fibonacci retracement). Tradingview link: https://www.tradingview.com/chart/XAUUSD/qZz02FeU-XAUUSD-Sell-Signal
-
XAUUSD: Sell Signal
- March 5, 2020
- Posted by: Tradingshot Articles
- Category: Commodities
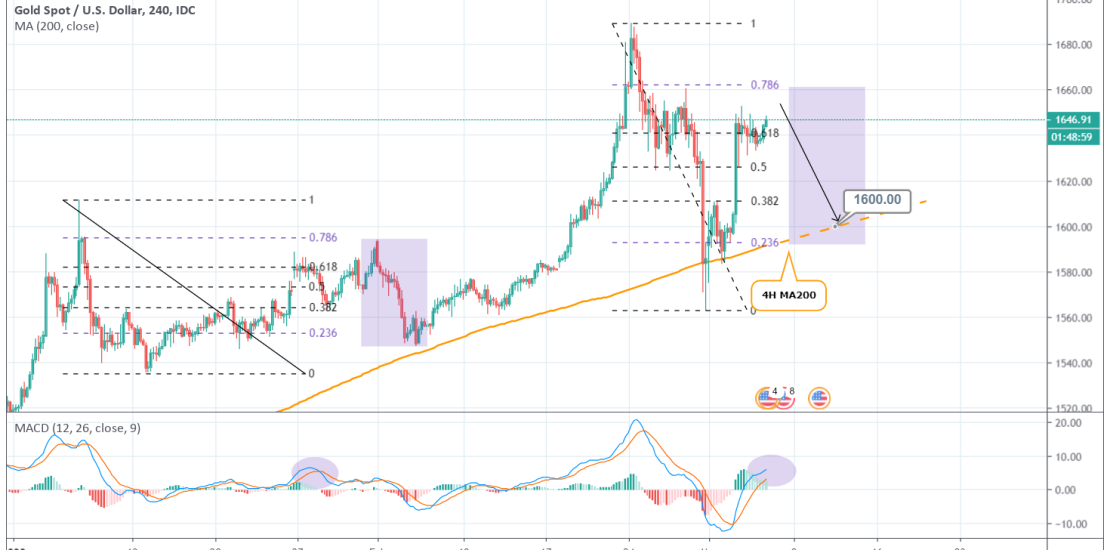
Pattern: 0.618 Fibonacci retracement on 4H. Signal: Bearish as the pattern appears to be repeating the similar January retracement sequence. Target: 1600 (expected contact with the 4H MA200). Previous Sell Signal: Tradingview link: https://www.tradingview.com/chart/XAUUSD/bwf6OeqF-XAUUSD-Sell-Signal
-
XRPUSD Still another 350 days of accumulation.
- February 28, 2020
- Posted by: Tradingshot Articles
- Category: Cryptocurrency
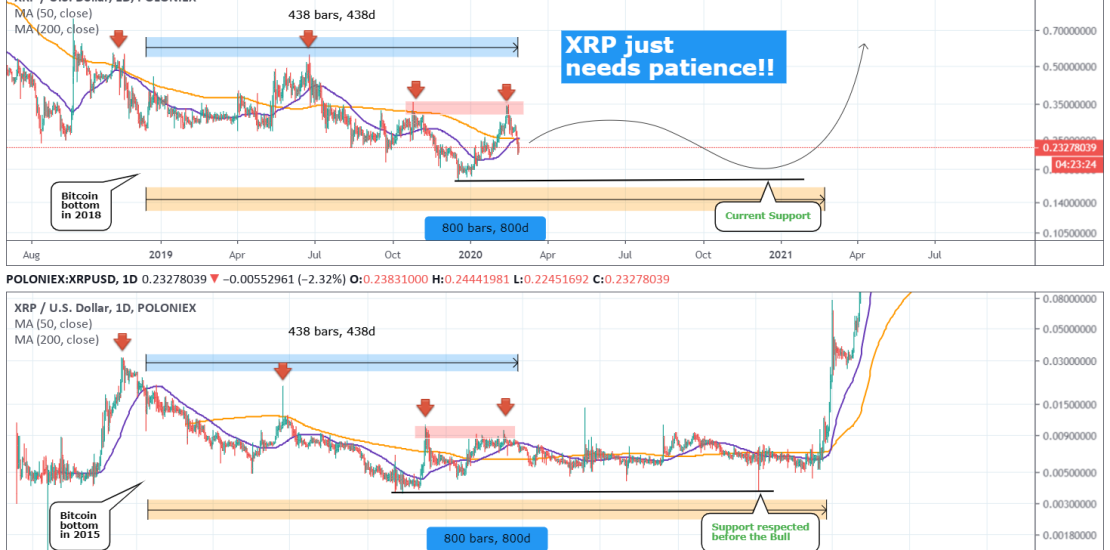
Ripple will get its chance to shine. There are few who argue the opposite. In this quick idea though I show why this time is not quite there yet. I have scaled XRP’s timeline based on Bitcoin’s Cycle from top to bottom. BTC’s bottom of the previous Bear Cycle was mid December 2018 and the
-
BITCOIN The Golden 51%-49% Ratio! 600 days of Bull Market left!
- February 22, 2020
- Posted by: Tradingshot Articles
- Category: Cryptocurrency
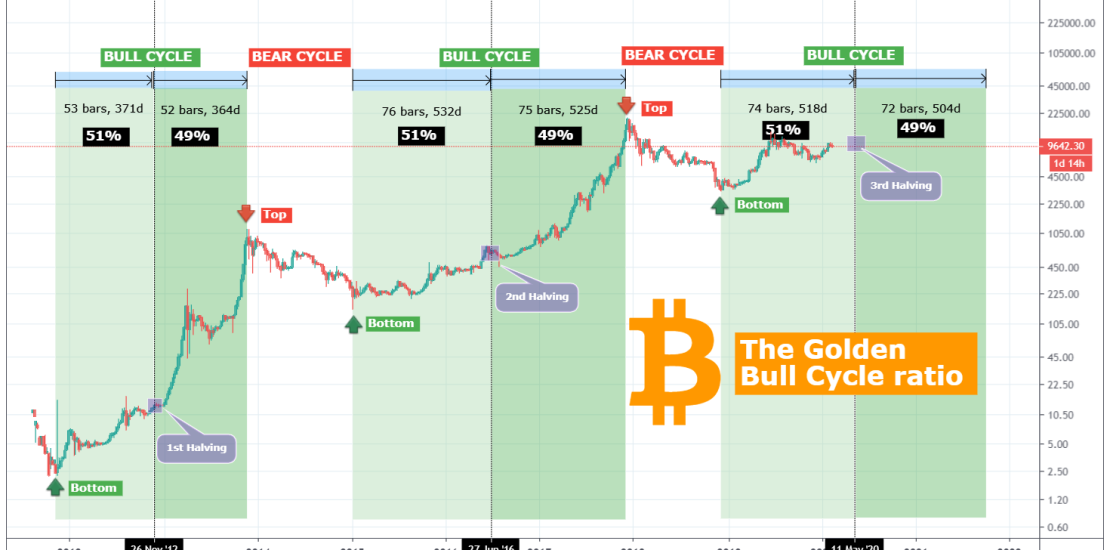
This is a really simple Bitcoin study on which I calculate the remaining days of the current Bull Cycle we are in based on the Top, Bottom and Halving of each Cycle. These parameters are effectively used to distinguish the Bull from the Bear Cycles. Tops are obviously where the Bull phase ends and Bear
-
DKKJPY Sell Signal
- February 21, 2020
- Posted by: Tradingshot Articles
- Category: Forex
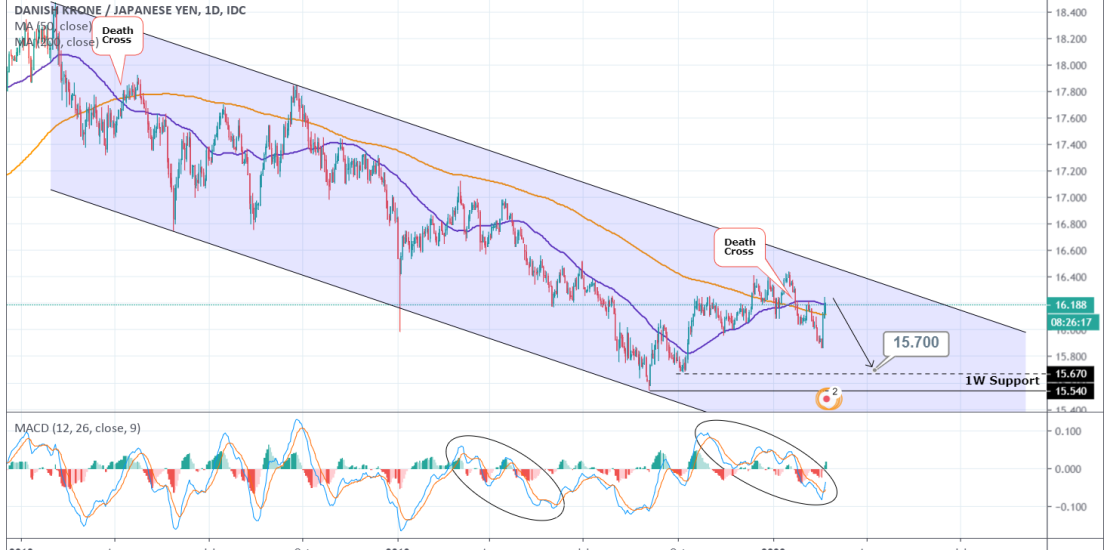
Pattern: Channel Down on 1M. Signal: Bearish as 1D made a Death Cross and started a new bearish leg. Target: 15.700 (just above the 1W Support). Tradingview link: https://www.tradingview.com/chart/DKKJPY/ZHfdzvjl-DKKJPY-Sell-Signal