2020 April
-
BITCOIN What does the Divergence/ Convergence Market Model show?
- April 30, 2020
- Posted by: Tradingshot Articles
- Category: Cryptocurrency
No Comments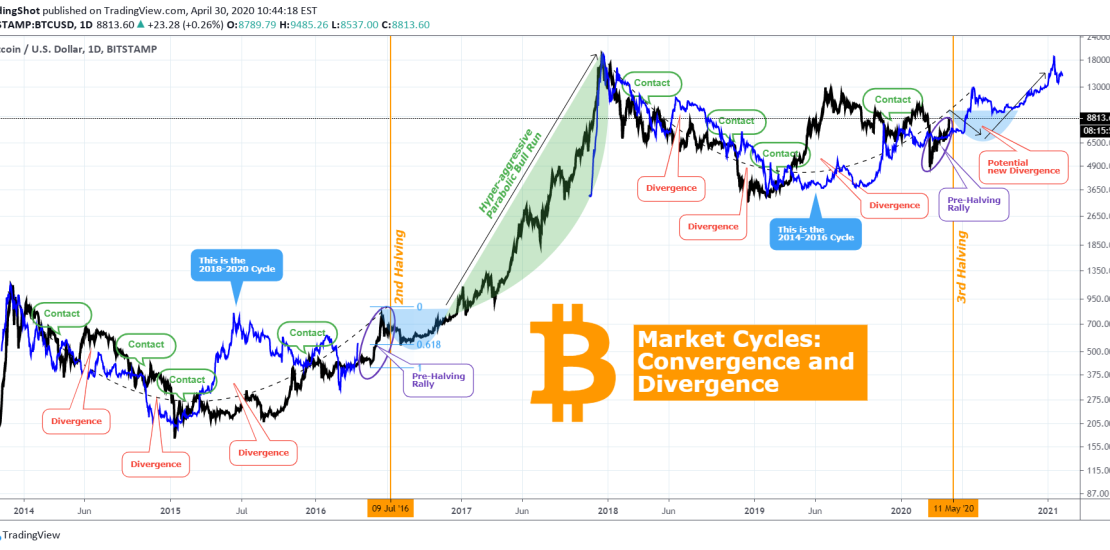
So Bitcoin eventually turned bullish after breaking the 1W MA20 and is approaching the $10000 mark as I mentioned 5 days ago on the following chart: ** Before we start, please support this idea with your likes and comments, it is the best way to keep it relevant and support me. ** We are
-
EURCAD Buy Signal
- April 29, 2020
- Posted by: Tradingshot Articles
- Category: Forex
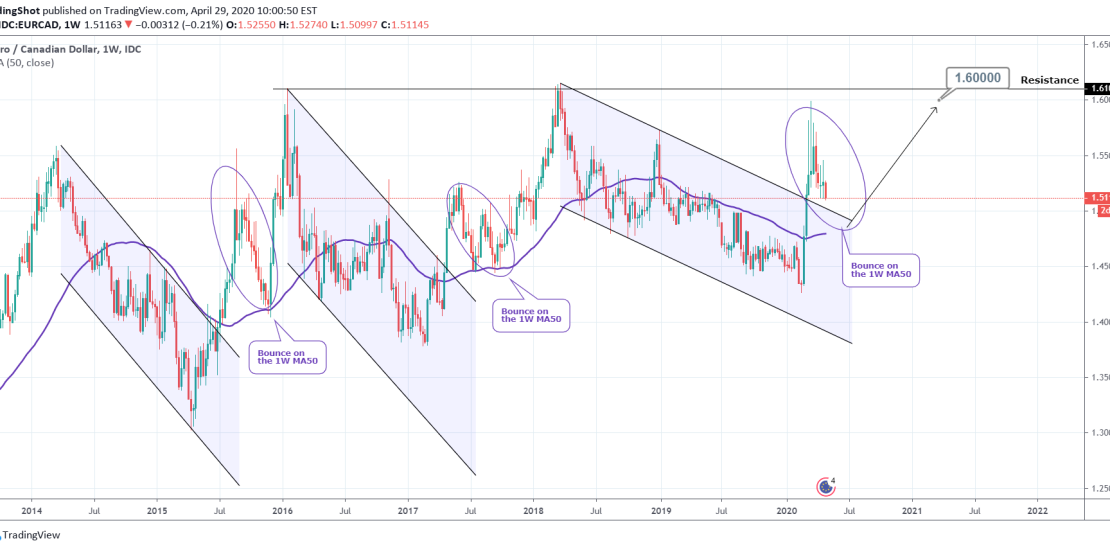
Pattern: Pull back towards the 1W MA50. Signal: Bullish once the price makes contact with the 1W MA50. It is a recurring pattern since 2014. After a Channel Down, the price breaks upwards the then pulls back for a bounce on the 1W MA50 before making a new High. Target: 1.6000 (just below the
-
BITCOIN marching to the 1W MA20 with the LMACD turning BULLISH!
- April 24, 2020
- Posted by: Tradingshot Articles
- Category: Cryptocurrency
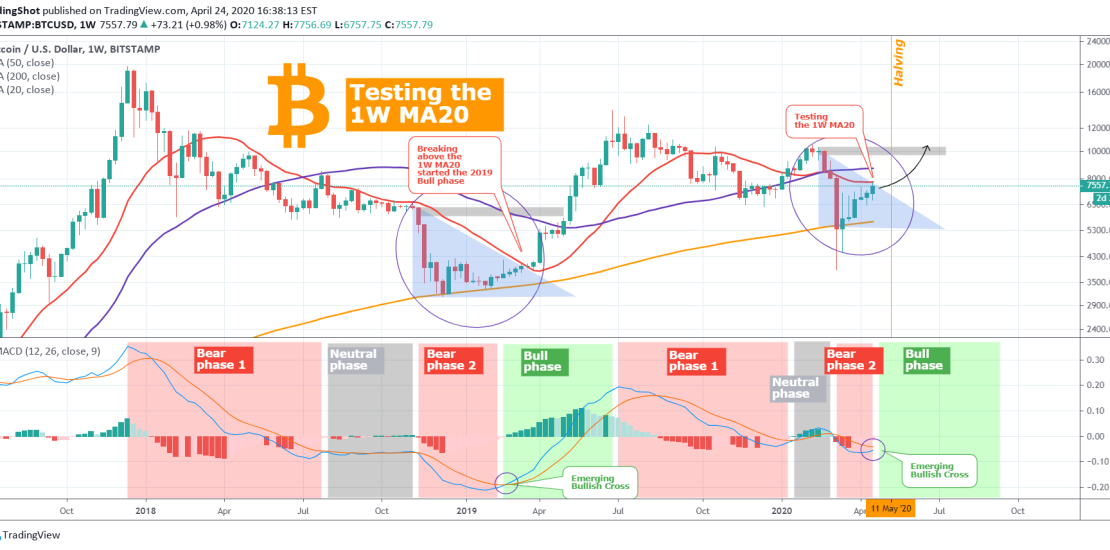
The title is descriptive enough as it is. Bitcoin is posting a fair run this week and is testing the 1W MA20 (red trend-line on the chart). At the same time the LMACD (which for those who follow me know it has been a very reliable indicator) is about to make a bullish cross.
-
S&P500 Is COVID just a bounce inside the Channel?
- April 23, 2020
- Posted by: Tradingshot Articles
- Category: Stock Indices
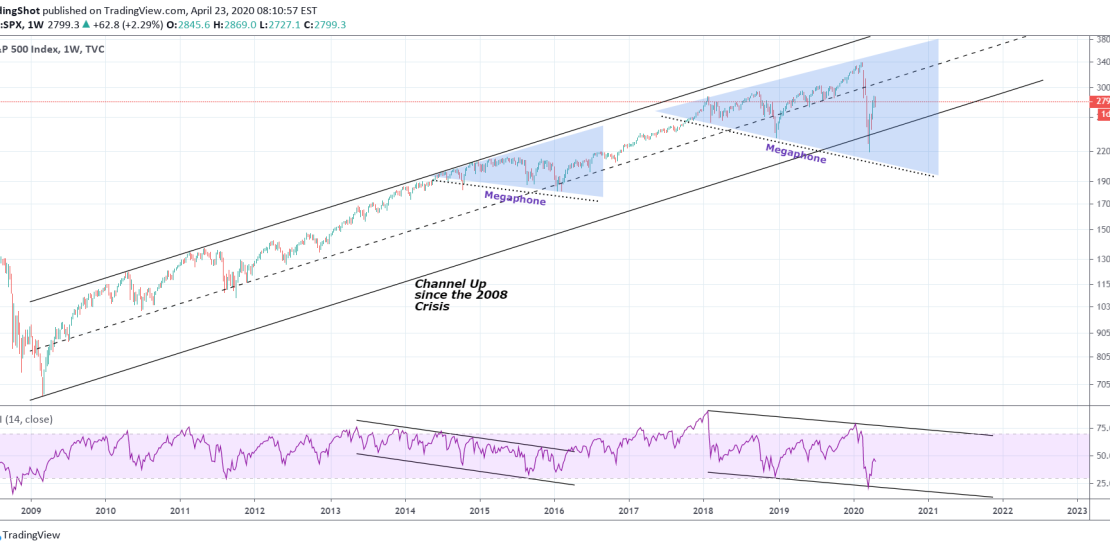
* Please support this idea with your likes and comments, it is the best way to keep it relevant and support me. ** Well as you see the chart is pretty explanatory. I want your thoughts on a simple question. Was the sell-off driven by the COVID pandemic just a necessary technical bounce inside the
-
EURUSD Trading plan
- April 21, 2020
- Posted by: Tradingshot Articles
- Category: Forex
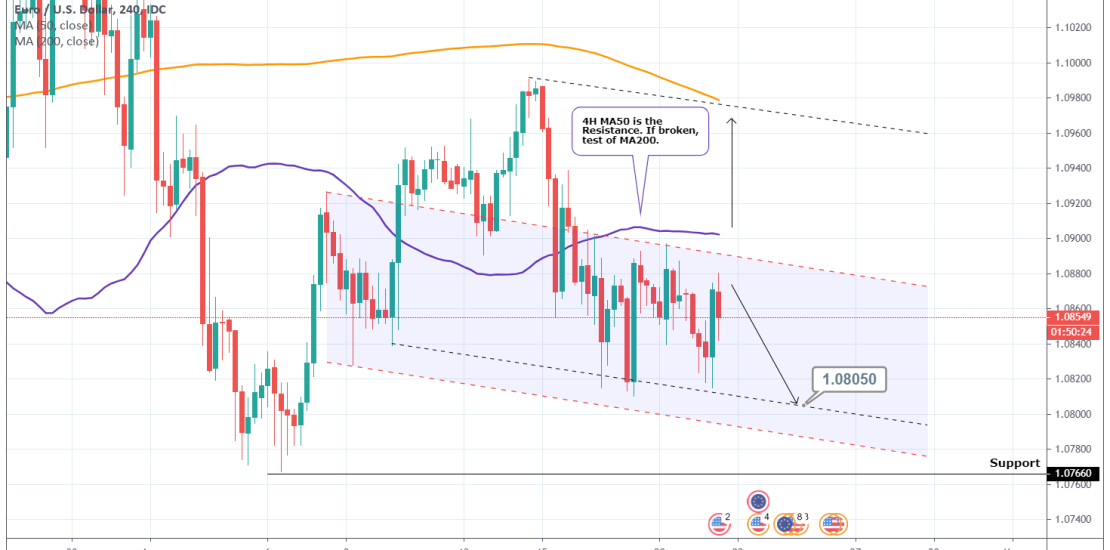
Pattern: Channel Down on 4H. Signal: Bearish as the price is close to the Lower High trend line of the pattern. The trend is bearish as long as the 4H MA50 is intact. If crossed, expect a test of the 4H MA200. Target: 1.08050 (the inner Lower Low trend line). My long term view and
-
BITCOIN The BEST BUY SIGNAL we will ever get.
- April 15, 2020
- Posted by: Tradingshot Articles
- Category: Cryptocurrency
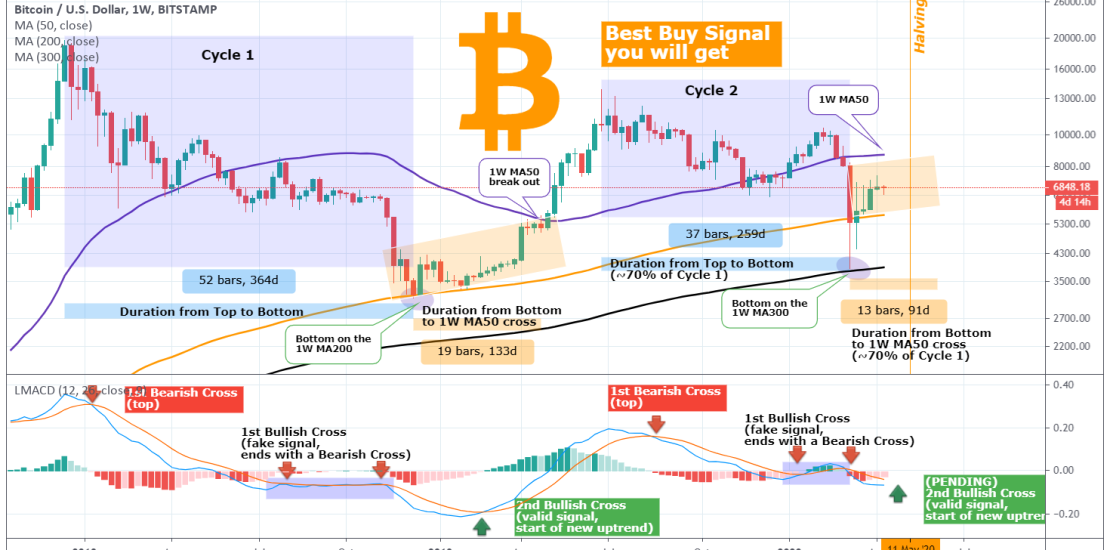
** Cycle 1 vs Cycle 2 ** If this consolidation is extended then we may have a similar pattern as in January – March 2019 (the subject I’ve been discussing for a long time). Since the two mini Cycles (December 2017 – April 2019: Cycle 1 and June 2019 – date: Cycle 2) are
-
EURUSD Sell Signal
- April 13, 2020
- Posted by: Tradingshot Articles
- Category: Forex
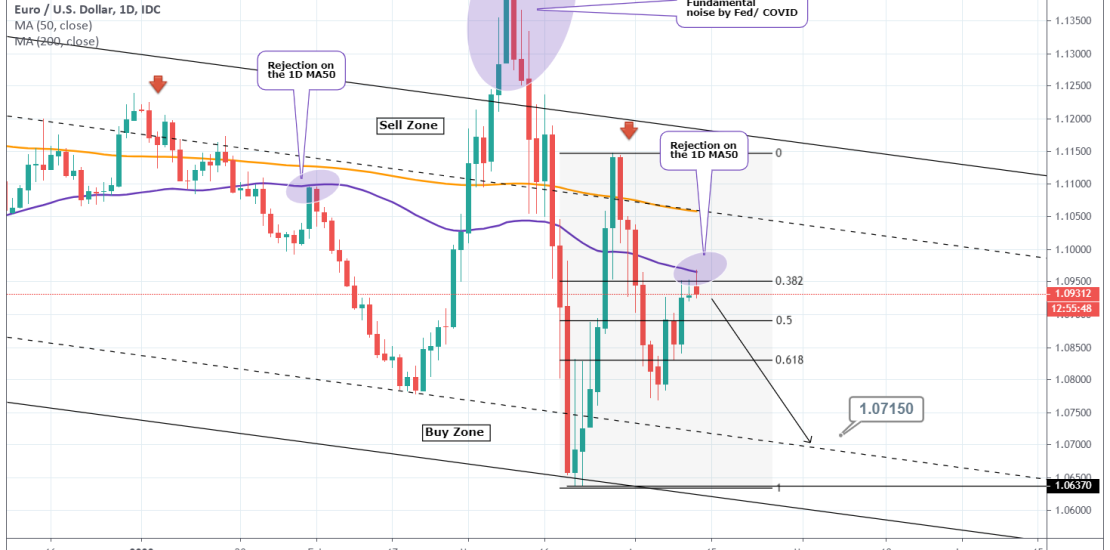
Pattern: Channel Down on 1D. Signal: Bearish as the price is testing the 1D MA50, which has previously been a rejection point. Target: 1.07150. * This is a continuation of our previous Sell Signal which has already hit its first (1.08350) target: Tradingview link: https://www.tradingview.com/chart/EURUSD/TuJ7UtxV-EURUSD-Sell-Signal
-
BITCOIN Testing the 1D MA50. An RSI Fractal & Fibonacci analysis
- April 9, 2020
- Posted by: Tradingshot Articles
- Category: Cryptocurrency
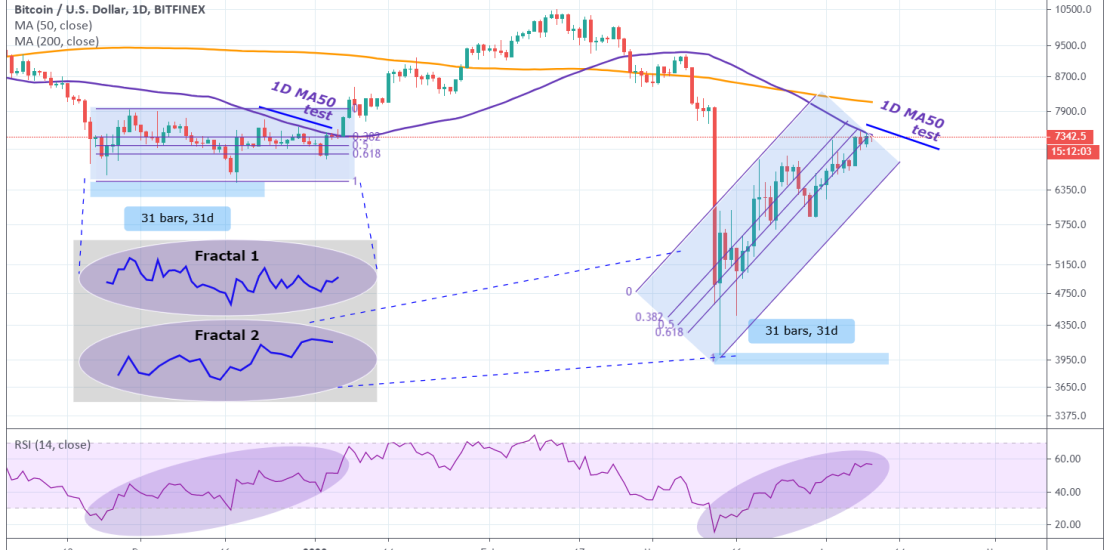
Everyone is talking about Bitcoin testing the 1D MA50 and deservedly so as it is a critical test in order to sustain the current uptrend. Before we start please support this idea with your likes and comments, it is the best way to keep it relevant and support me. ** The RSI ** To begin
-
XAUUSD Daily trading plan
- April 8, 2020
- Posted by: Tradingshot Articles
- Category: Commodities
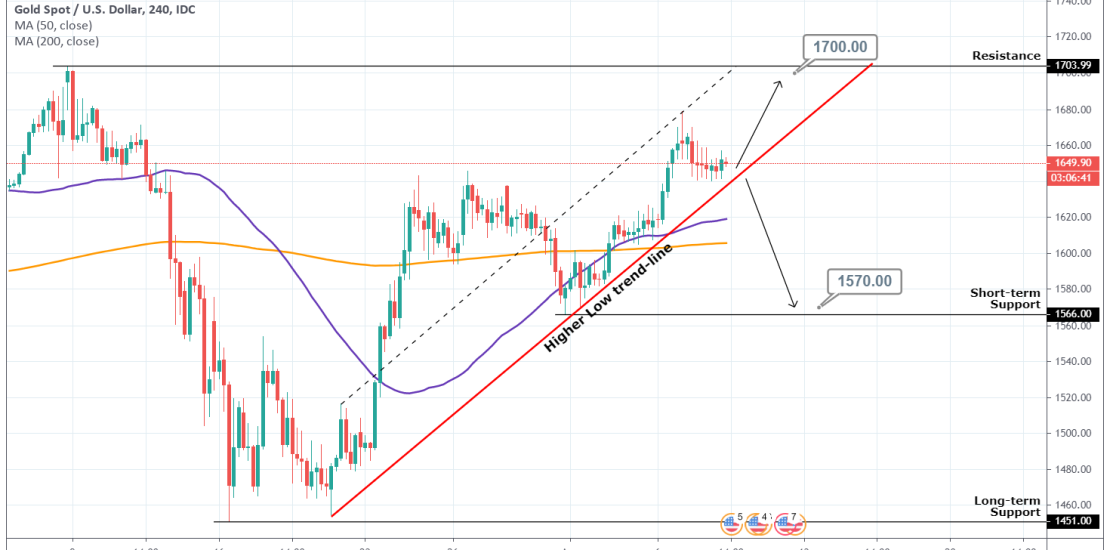
Pattern: Higher Low sequence on 4H. Signal: (A) Bullish as long as the Higher Low trend-line (red) holds, (B) Bearish if it breaks. Target: (A) $1700 (Just below the Resistance), (B) 1,570 (just above the short-term Support). Tradingview link: https://www.tradingview.com/chart/XAUUSD/ErxDI1zA-XAUUSD-Daily-trading-plan
-
GBPPLN Sell Signal
- April 7, 2020
- Posted by: Tradingshot Articles
- Category: Forex
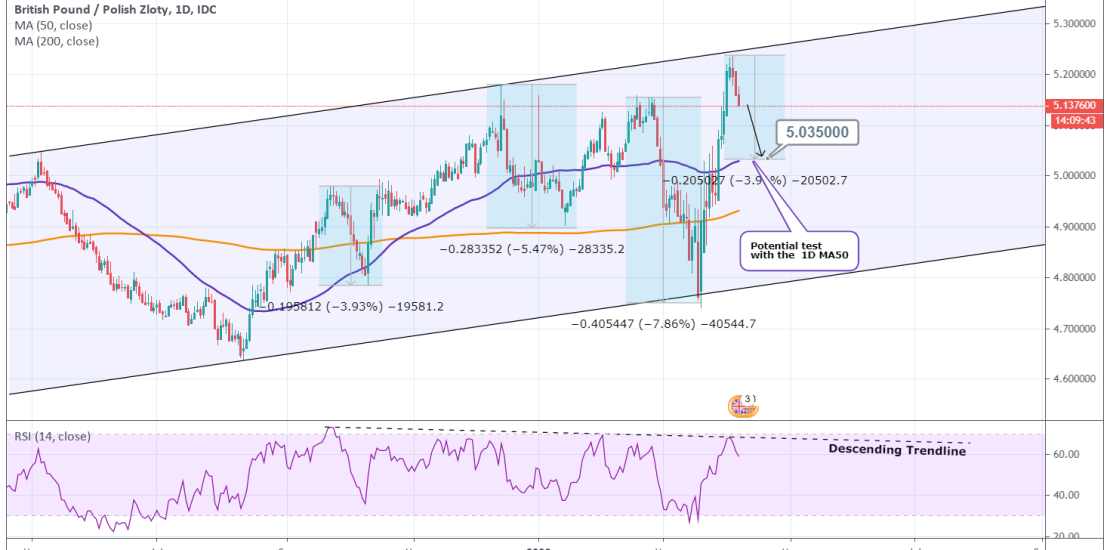
Pattern: Channel Up on 1D. Signal: Bearish as the pattern made a Higher High and is descending towards the Higher Low trend line. The RSI is also on a Descending trend line. Target: 5.035 (around -3.90% from the High, similar to the weakest drop after an RSI Lower High). Tradingview link: https://www.tradingview.com/chart/GBPPLN/bGqiIi97-GBPPLN-Sell-Signal
- 1
- 2

