

- April 30, 2020
- Posted by: Tradingshot Articles
- Category: Cryptocurrency
So Bitcoin eventually turned bullish after breaking the 1W MA20 and is approaching the $10000 mark as I mentioned 5 days ago on the following chart:

** Before we start, please support this idea with your likes and comments, it is the best way to keep it relevant and support me. **
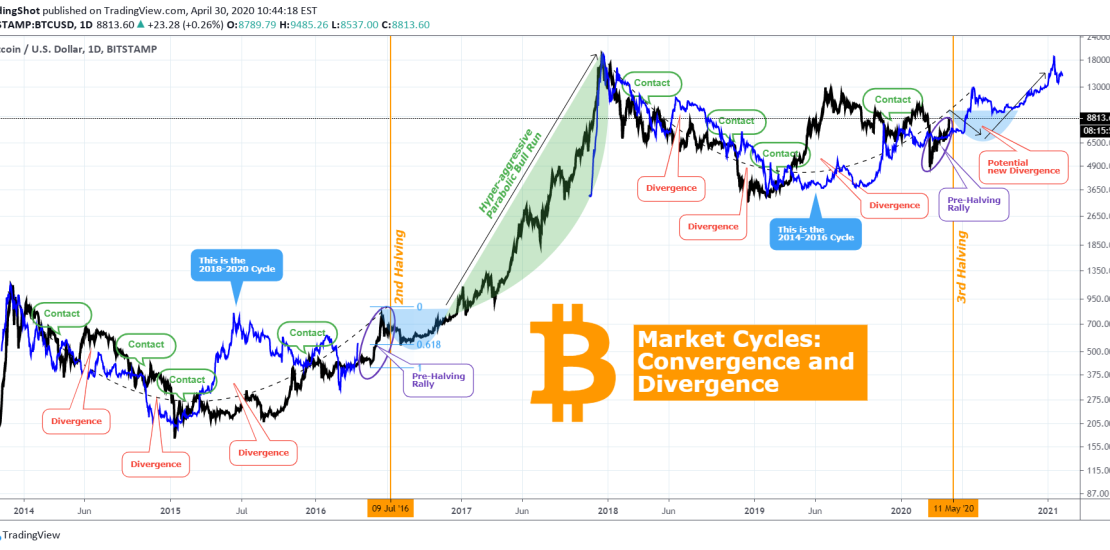
We are now at a point where I want to bring to your attention again the Divergence/ Convergence Market Model. For those who haven’t been following me for long, this is a study that I initially made almost a year ago (May 16, 2019) on Bitcoin’s Divergence and Convergence of the current and previous Market Cycles:

It shows how the current (2018-2020) and previous (2014-2016) BTC Market Cycles always converged back together after a divergence on their price sequence occurred. The chart pretty much speaks for itself, it shows all the times they diverged only to come back together (converge) later. Note that the black line is the full continuous price sequence of Bitcoin, while the blue lines on top of the black are other Market Cycle on top of the current for comparison purposes (i.e. the current Cycle (right hand side) has the 2014-2016 Cycle on top of it with the blue line while the previous Market Cycle (left hand side) has the 2018-2020 sequence on it with blue).
** Where are we now **
At the moment the price is again slightly diverging from the 2014-2016 pattern. Fundamentally this can be due to the upcoming 3rd Halving which is less than 2 weeks away. As seen on the chart prior to the 2nd Halving in 2016, Bitcoin again rallied. What happened after that? The price pulled back to the 0.618 Fibonacci and consolidated for about 4 months before starting the final and hyper-aggressive parabolic phase of the Bull Market.
It is possible to see a similar price action, i.e. peak around the Halving and then pull-back and consolidation. This will serve pretty well the model as it will mean a new Potential Divergence as you see on the chart.
Please note that this is not a perfect model (as no model is) as the BTCUSD price can be stimulated by the fundamental factors of the market (like news or stock market volatility) as we saw with the May-June 2019 hyper extension of the rally to $13800 (due to Libra and other bullish news) which diverged the Cycles more even though they should have converged in August or the March crash (due to the stock market collapse on COVID-19).
I encourage investors to filter out this very carefully as the worst thing you can do is fail to invest now and miss out on the Hyper-aggressive Parabolic run of the Bull Market when it is just about to start (while you managed to get through the pain and anxiety of a 2 year Bear Market), while waiting for a pull-back that may never come. The essence of such studies is to show when and where we can accumulate more BTC (while we are already invested in the market) by the method of scaling and not show where you can buy ‘all-in’ with your whole capital. This is not the way Bitcoin investing works and you certainly don’t want to miss on a 10X return investing opportunity.
How useful do you find this study? Do you agree with the Divergence/ Convergence Market Model? Feel free to share your work and let me know in the comments section!
Please like, subscribe and share your ideas and charts with the community!
** Related Studies :


