2019 November
-
BITCOIN Will 2020 be the year of recovery and accumulation?
- November 30, 2019
- Posted by: Tradingshot Articles
- Category: Cryptocurrency
No Comments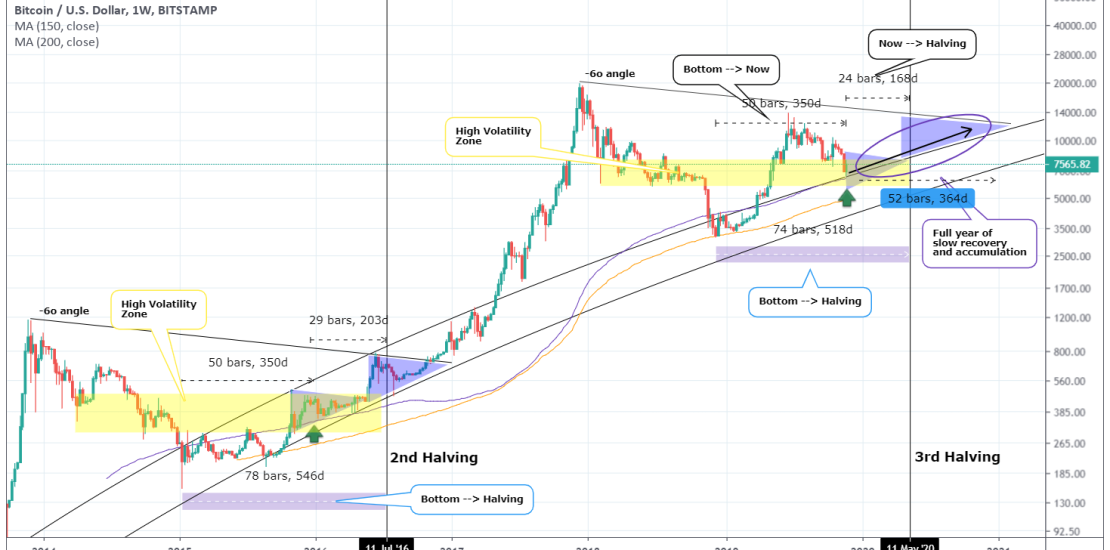
I have been asked by certain enthusiastic followers (I thank everyone for the support), to make an update on the following chart: *$6000 bottom while everyone was bullish to 20K* As you see it was late September with Bitcoin trading at $10000 and everyone pretty bullish when this idea was published talking about a potential
-
MATICBTC All targets hit. One last spike left?
- November 30, 2019
- Posted by: Tradingshot Articles
- Category: Cryptocurrency
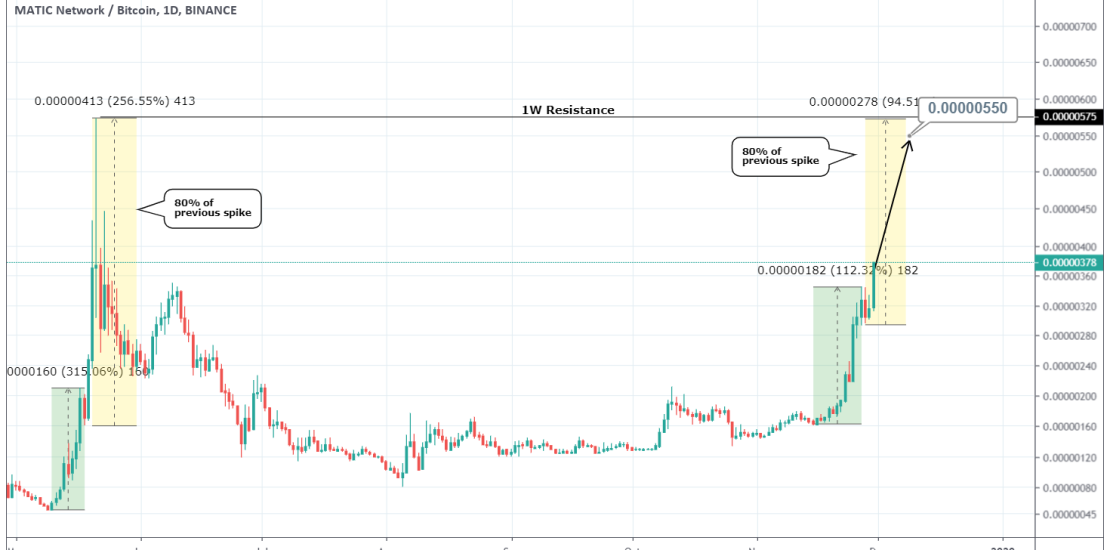
This is a follow up of the last MATICBTC call where both Targets got hit (0.00000268 and 0.00000350) as you can see below: Now I have found an interesting correlation for those of you who want to take some more risk. The similarities with the May parabolic rise are strong. That sequence is divided
-
$6500 on BITCOIN there you have it! Final flush and up we go!
- November 25, 2019
- Posted by: Tradingshot Articles
- Category: Cryptocurrency
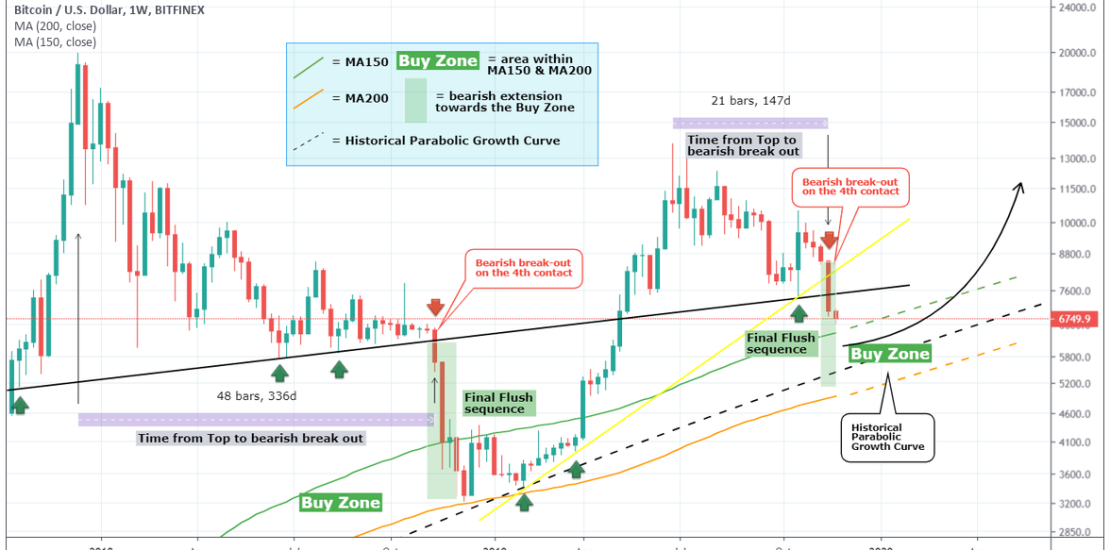
Well eventually all projections for a $6500 price on Bitcoin have proved to be correct. The following study in particular came incredibly close to estimating 6500 on December 1: *The 4th contact sell-off* What I want to focus on today is an analysis I posted 5 days ago (see the chart right below) when
-
WTI OIL Neutral sentiment. Trade the break-out.
- November 21, 2019
- Posted by: Tradingshot Articles
- Category: Commodities
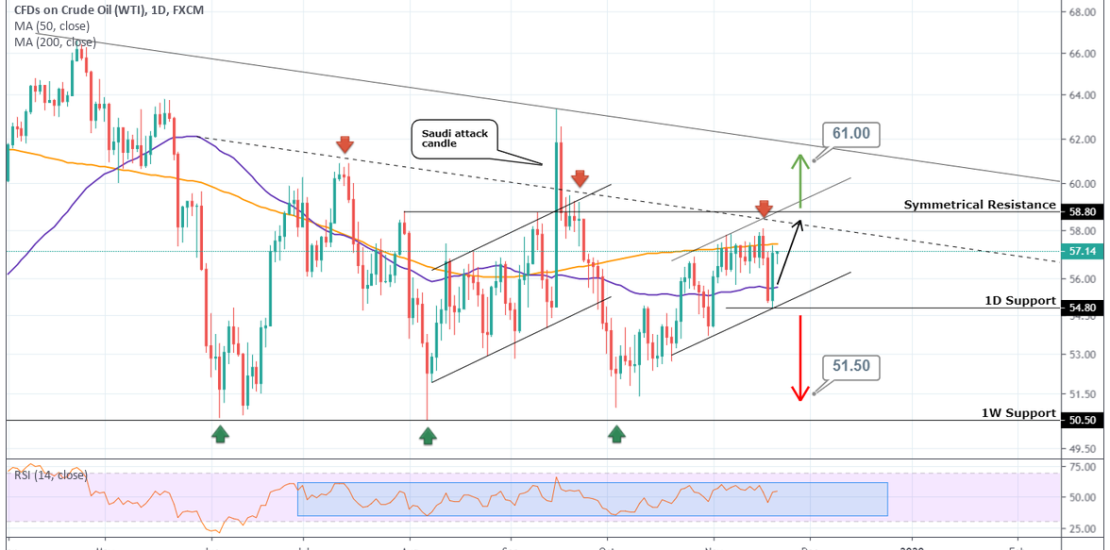
Pattern: 1W Descending Triangle . Signal: Bullish within the 1D Channel Up. Neutral outside so trade the break out: (A) Bullish above the 58.80 Symmetrical Resistance, (B) Bearish below the 54.80 1D Support. Target: Within the 1D Channel Up it is always the 58.80 Resistance. Outside is (A) = 61.00, (B) = 51.50. See how
-
AUDNZD Sell Signal
- November 14, 2019
- Posted by: Tradingshot Articles
- Category: Forex
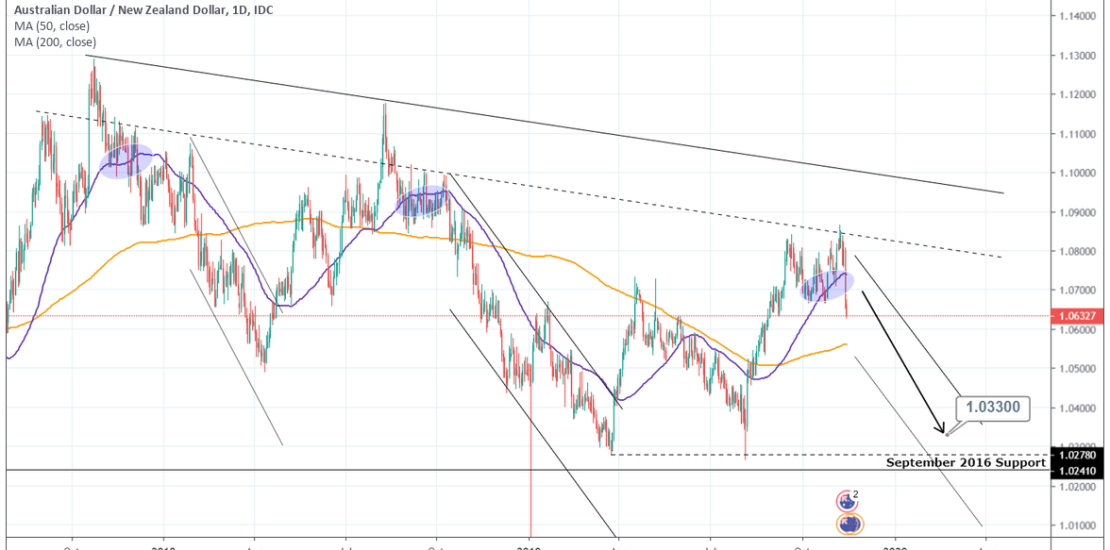
Pattern: 1M Descending Triangle. Signal: Bearish as the price broke below the D MA50 on a strong candle. Target: 1.03300 (just above the 1M Support). Tradingview link: https://www.tradingview.com/chart/AUDNZD/PUklChTV-AUDNZD-Sell-Signal
-
LINKBTC Parabolic to 0.00055.
- November 13, 2019
- Posted by: Tradingshot Articles
- Category: Cryptocurrency
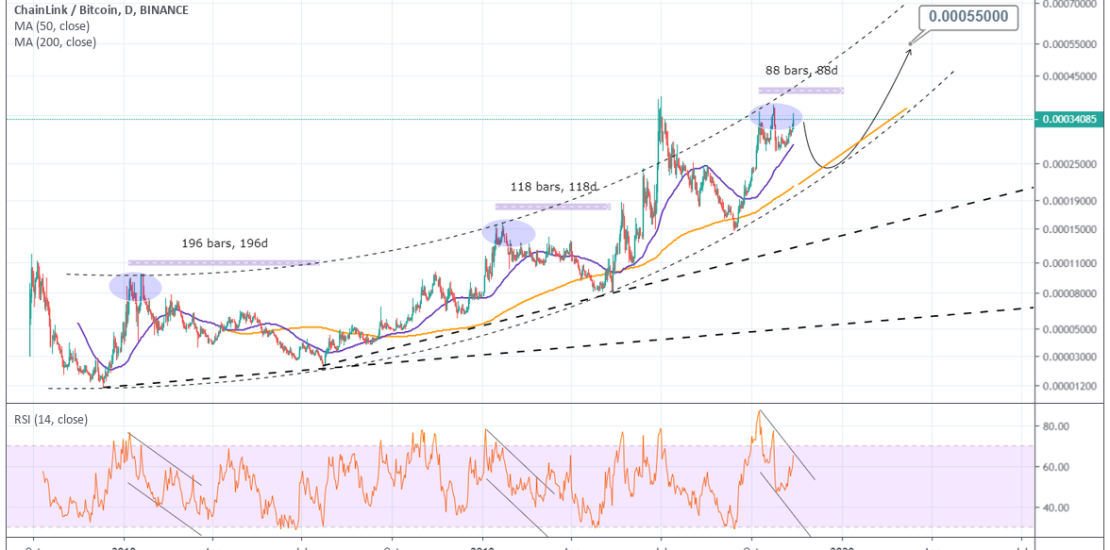
Buyers can be very pleased just by looking this chart of Chainlink. One of the most profitable coins lately being parabolic to Bitcoin. As seen on the chart, when the RSI posts this bearish divergence with the price candles hitting Double Tops, the pair makes a top, pulls back and consolidates until the next
-
HANG SENG Buy Signal
- November 13, 2019
- Posted by: Tradingshot Articles
- Category: Stock Indices
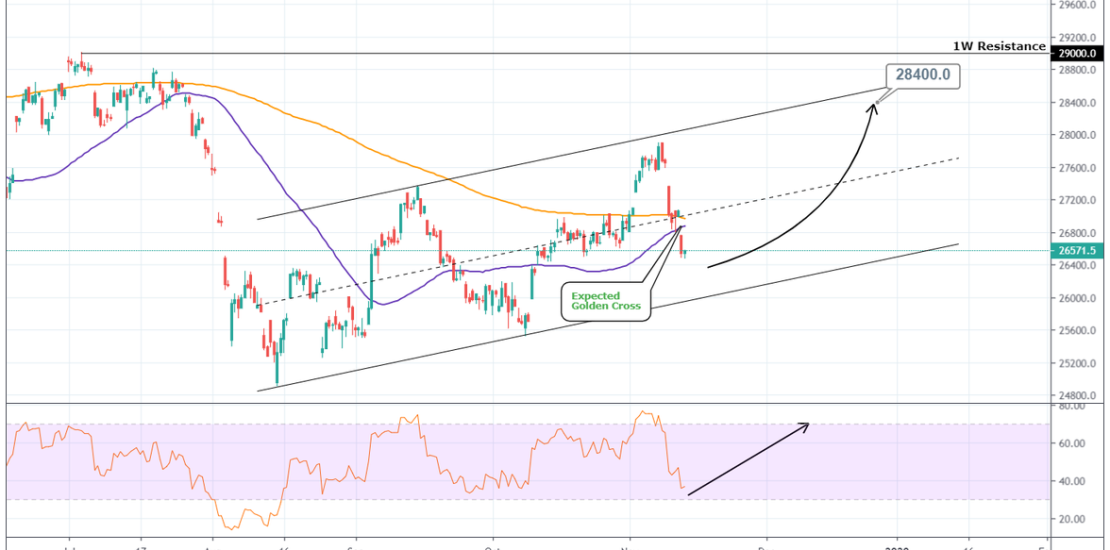
Pattern: Channel Up on 1D. Signal: Bullish as the pattern is approaching its Higher Low and the 4H RSI is on support levels. Target: 28400 (below the 1W Resistance). Tradingview link: https://www.tradingview.com/chart/HSI/TOol9A5F-HANG-SENG-Buy-Signal
-
Is this a sign that the ALT SEASON has started?
- November 12, 2019
- Posted by: Tradingshot Articles
- Category: Cryptocurrency
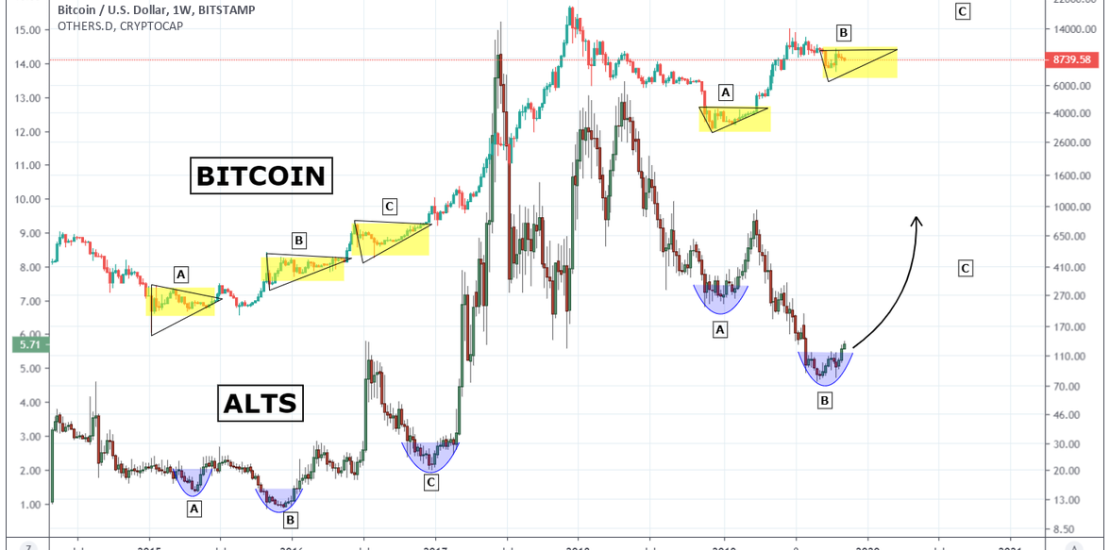
I will keep things very simple this time in my attempt to determine if we have started a new Bulls Cycle on the Alt Coins. On this chart I compare Bitcoin to Alts Dominance. It seems quite obvious to me that when a certain patterns form both on BTC and ALTS at the same
-
CADJPY Sell Signal
- November 12, 2019
- Posted by: Tradingshot Articles
- Category: Uncategorized
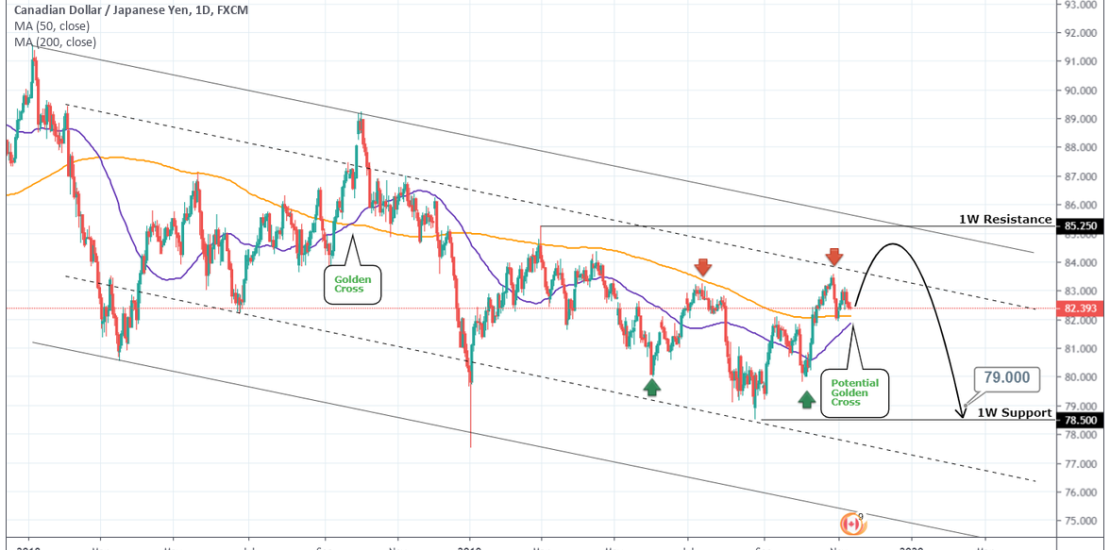
Pattern: 1M Channel Down. Signal: Bearish once the Lower High is made (near the 1W Resistance) after the 1D Golden Cross takes place. Target: 79.000. Tradingview link: https://www.tradingview.com/chart/CADJPY/1nhpjfd6-CADJPY-Sell-Signal
-
CHFPLN Action Plan
- November 11, 2019
- Posted by: Tradingshot Articles
- Category: Uncategorized
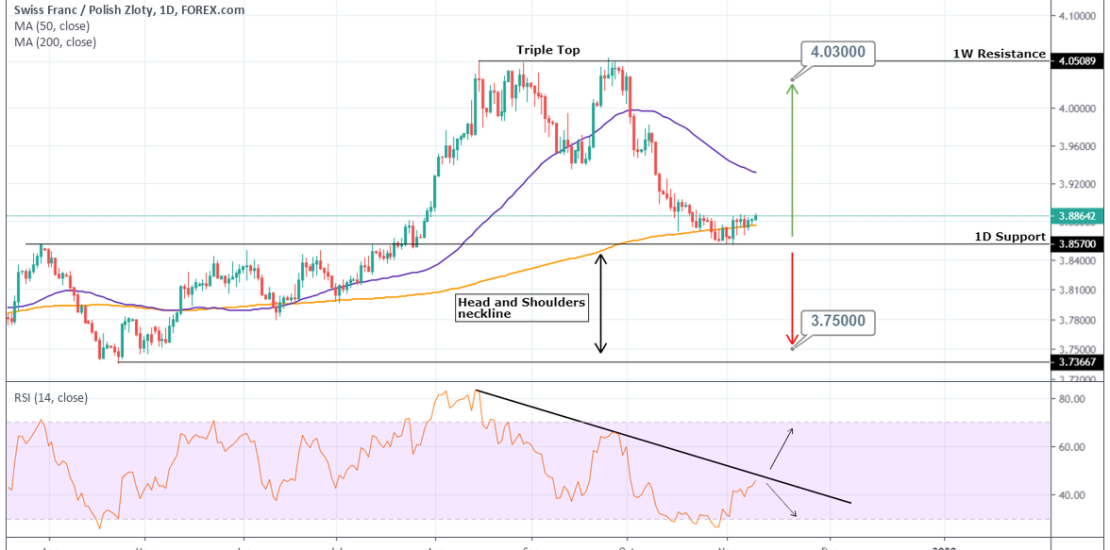
Pattern: Potential Head and Shoulders on 1W. Signal: (A) Bearish if the 3.85700 1D Support breaks, (B) bullish if it holds. Target: (A) 3.75000, (B) 4.03000. Tradingview link: https://www.tradingview.com/chart/CHFPLN/SdzgiPqF-CHFPLN-Action-Plan
- 1
- 2

