

- October 2, 2019
- Posted by: Tradingshot Articles
- Category: Uncategorized
No Comments
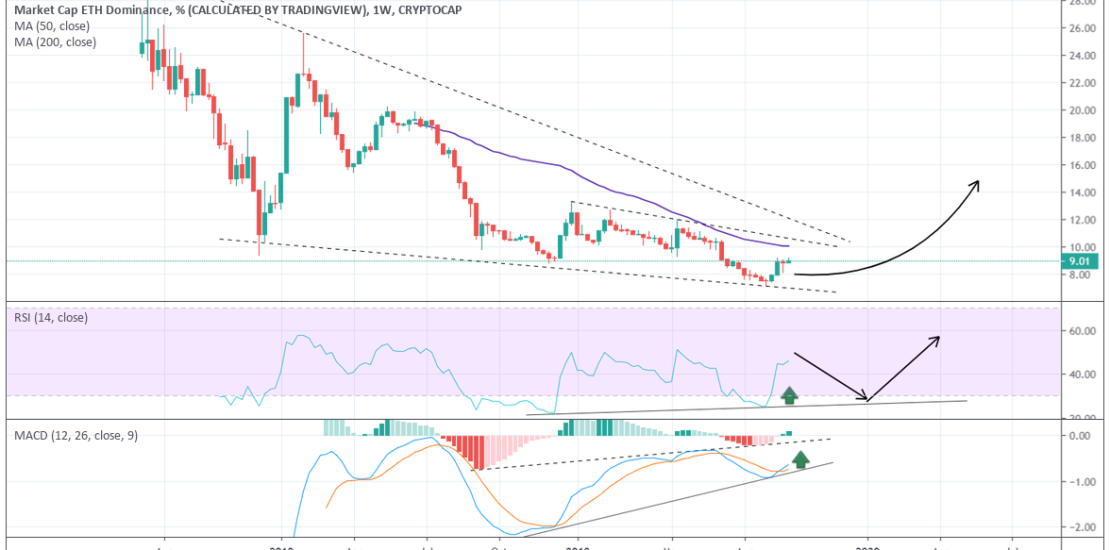
With Ethereum approaching again the 1W MA50 on the dominance chart, I thought it would be a could time to look at its key indicators, RSI and MACD. Both show a Bullish Divergence despite trading on a Falling Wedge printing Lower Lows.
Do you agree with this chart?
Tradingview link:
https://www.tradingview.com/chart/ETH.D/CuqVVzOI-ETH-DOMINANCE-Bullish-Divergence