-
EMERGING MARKETS 7 year bottom is in. Huge upside potential.
- March 16, 2023
- Posted by: Tradingshot Articles
- Category: Uncategorized
No Comments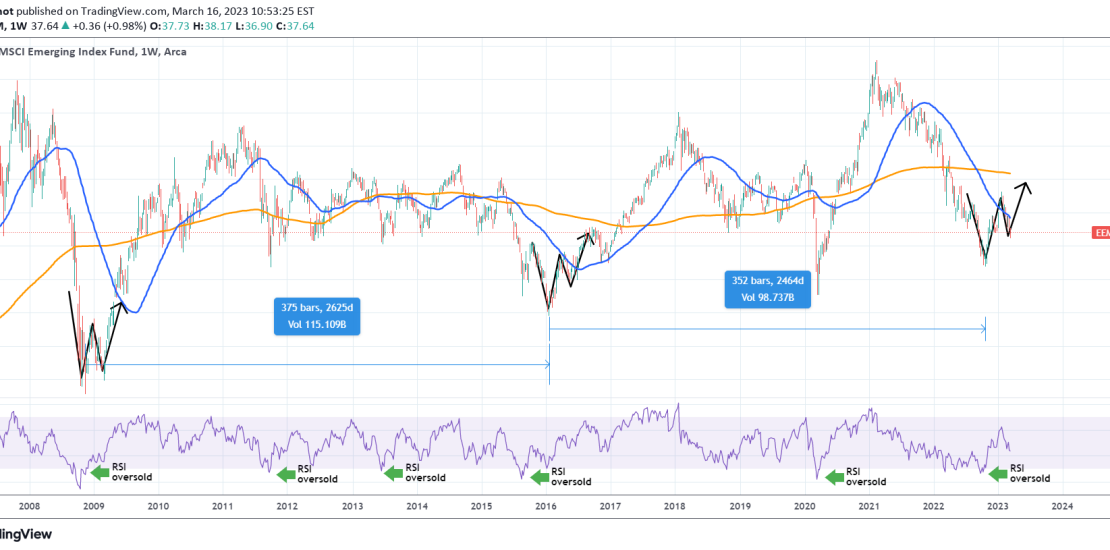
The MSCI Emerging Index Fund (EEM) is posting a bottom rebound pattern similar to early 2016 and 2009. All all cases the 1W RSI previously broke below the 30.00 oversold level and rebounded strongly. As you see these bottoms take place approximately every 7 years. This indicates that the Emerging Markets are only at the
-
MVUSD Broke above the 1D MA200 but one last Resistance remains.
- February 1, 2023
- Posted by: Tradingshot Articles
- Category: Uncategorized
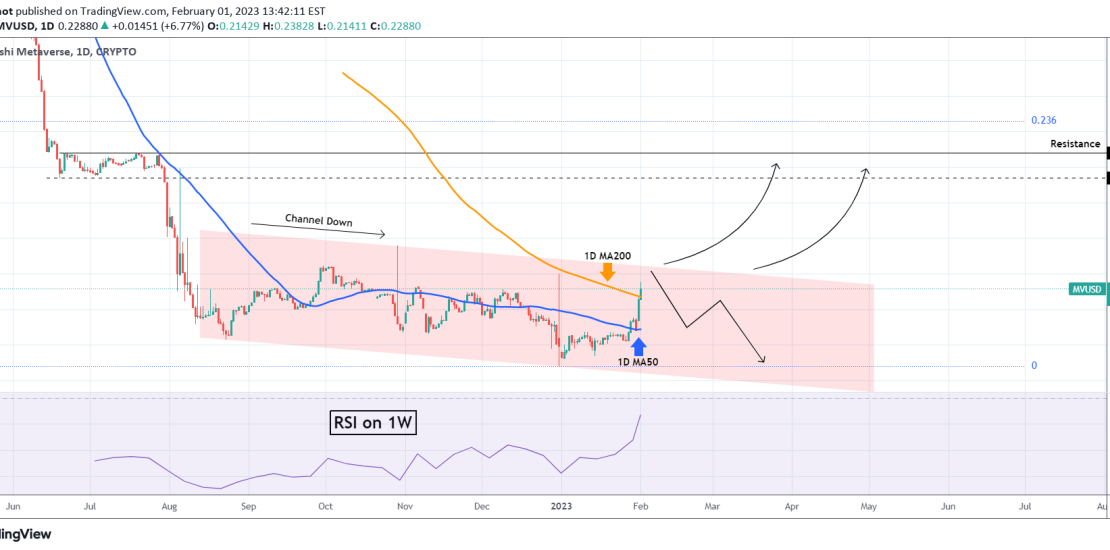
The GensoKishi Metaverse (MVUSD) broke today above its 1D MA200 (orange trend-line) for the first time in history after making a rebound on the 1D MA50 (blue trend-line). We are not getting excited yet as the price remains within the Channel Down pattern that started after the August 23 2022 Low. A break above the
-
APPLE Further correction ahead
- September 14, 2021
- Posted by: Tradingshot Articles
- Category: Uncategorized
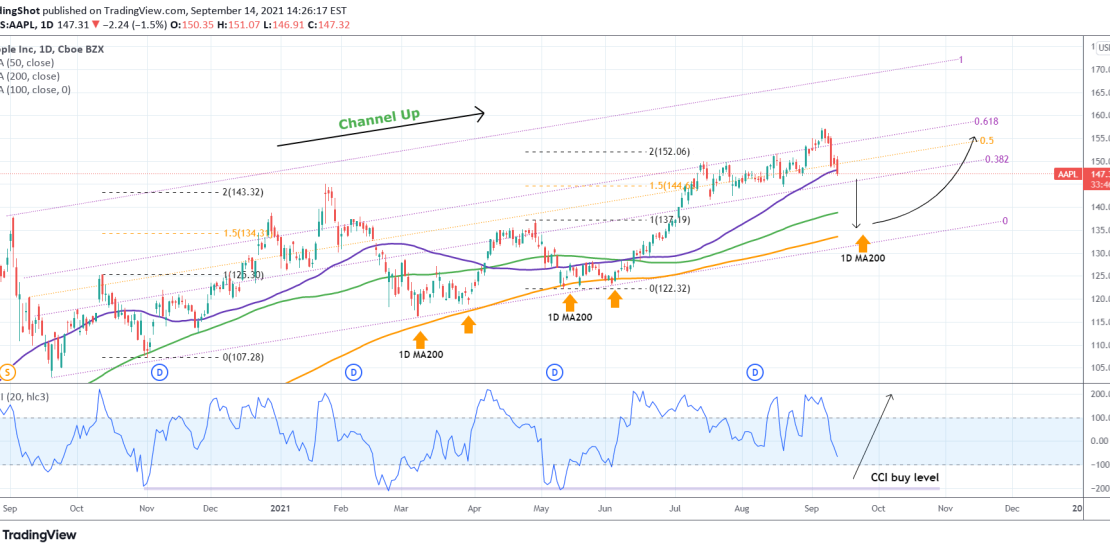
Pattern: Channel Up on 1D. Signal: Sell towards the 1D MA200 (orange trend-line) and reverse to a buy either upon contact (buy signal last time) or when the CCI hits its Buy Zone (confirmed 3 times since November 2020). Target: the 0.618 Fibonacci level. Tradingview link: https://www.tradingview.com/chart/AAPL/ppQOeczO-APPLE-Further-correction-ahead
-
S&P broke the 4H MA50. Starting the correction.
- September 7, 2021
- Posted by: Tradingshot Articles
- Category: Uncategorized
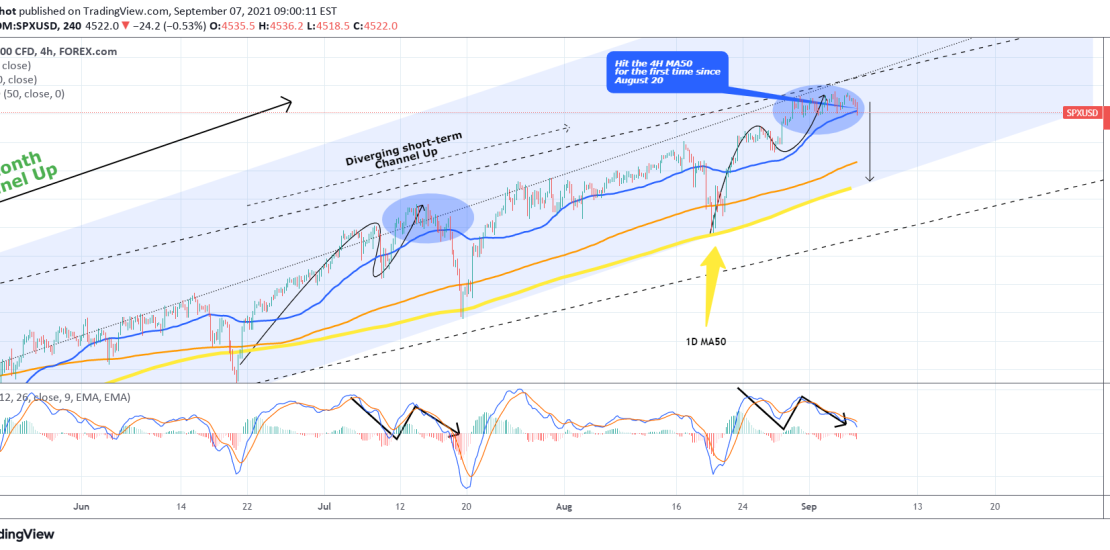
Pattern: Channel Up on 4H. Signal: Sell as the price broke below the 4H MA50 (blue trend-line) for the first time since August 20. Also the price action and the MACD is similar to the July 15 consolidation which also led to a pull-back below the 4H MA50. Target: The 1D MA50 (yellow trend-line),
-
COSTCO Strong buy opportunity on a 2-year old fractal
- June 29, 2021
- Posted by: Tradingshot Articles
- Category: Uncategorized
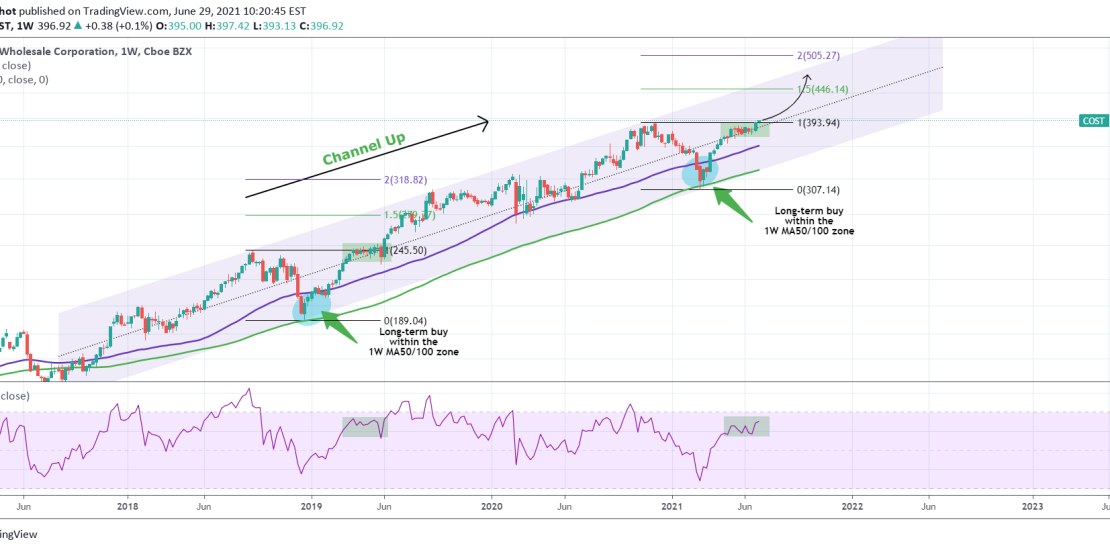
Pattern: Channel Up on 1W. Signal: Buy as the price broke above its Resistance (and November 2020 High), in a similar sequence as the April-May 2019 fractal. Even the RSI sequences are identical indicating that the price is breaking outside of this consolidation pattern. Target: Within the 1.5 – 2.0 Fibonacci extension zone (as
-
BITCOIN and VIX. Volatility Spike = BTC Bear Market?
- June 18, 2021
- Posted by: Tradingshot Articles
- Category: Uncategorized
-
US10Y Strong rejection on the 1D MA50. Long-term bearish sign?
- June 17, 2021
- Posted by: Tradingshot Articles
- Category: Uncategorized
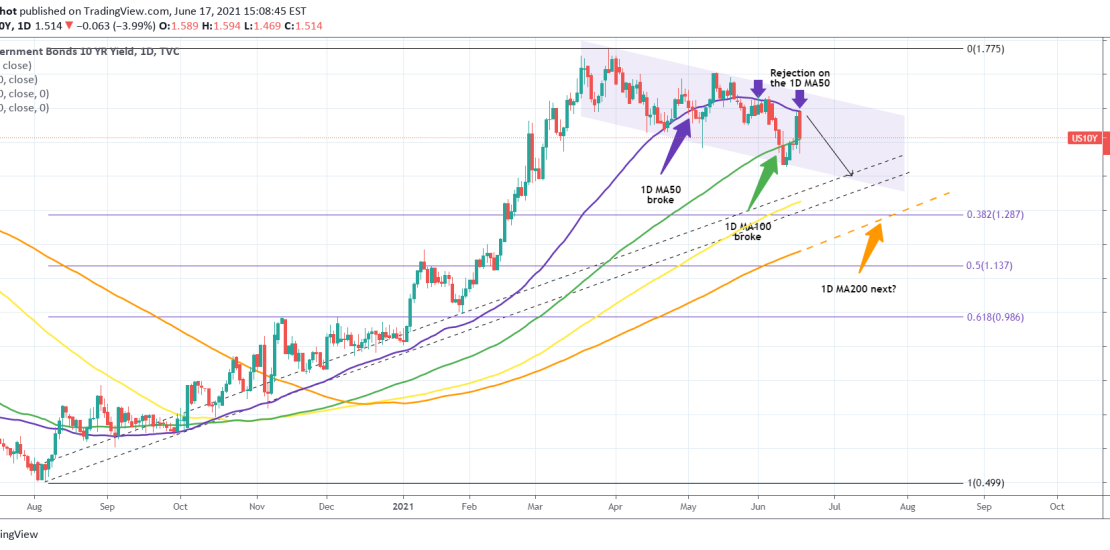
A perfect Channel Down has been formed for the US10Y on the 1D time-frame. The 1D MA50 and 1D MA100 have already been broken. The 1D MA150 (yellow trend-line) is exactly within the Higher Lows Zone from the very bottom of August 2020. Will the 1D MA200 (orange trend-line) get tested right on the
-
LUMBER Sell Signal
- June 7, 2021
- Posted by: Tradingshot Articles
- Category: Uncategorized
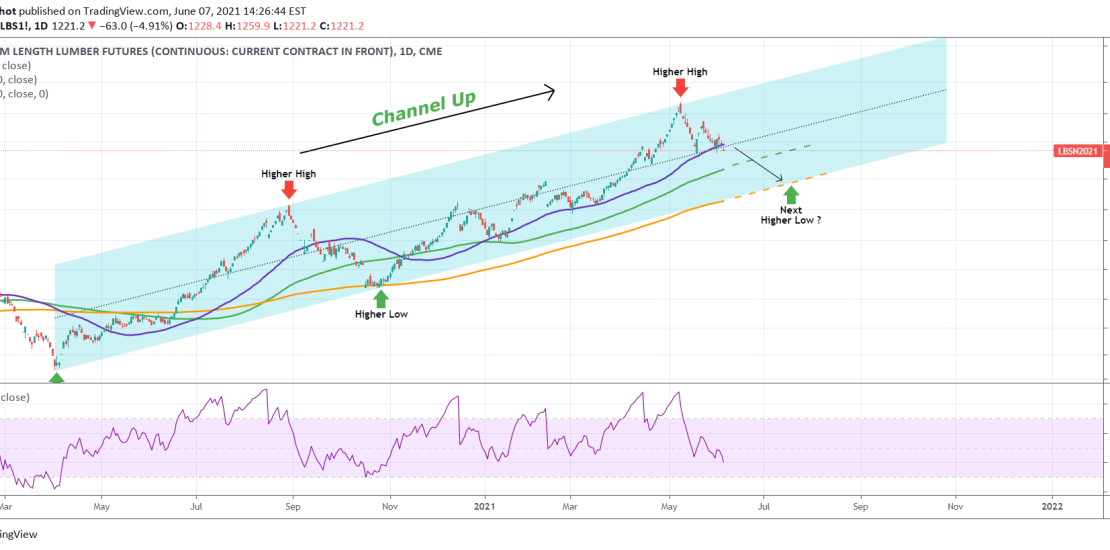
Pattern: Channel Up on 1D. Signal: Sell as the price got rejected on the Higher Highs trend-line of the Channel Up. Target: The 1D MA100 (green trend-line) on the short-term and the 1D MA200 (orange trend-line) on the medium-term. Tradingview link: https://www.tradingview.com/chart/LBS1!/73Rnsbxq-LUMBER-Sell-Signal
-
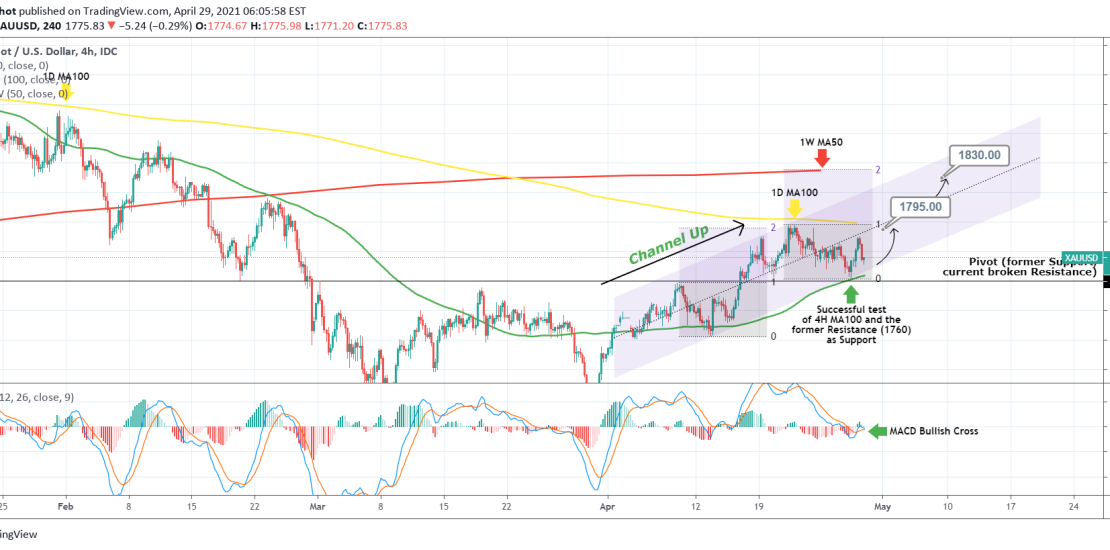
GOLD Successful test of 1760 as Support. Bullish.
- April 29, 2021
- Posted by: Tradingshot Articles
- Category: Uncategorized
-
COPPER showing strength. Buy opportunity.
- January 21, 2021
- Posted by: Tradingshot Articles
- Category: Uncategorized
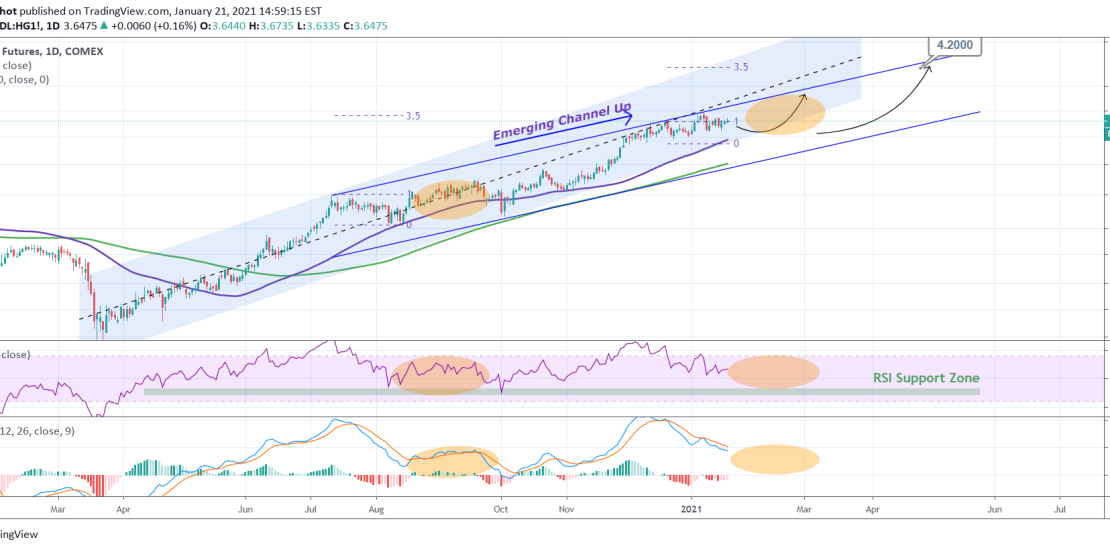
Pattern: Channel Up on 1D. Signal: Buy as the RSI and MACD are approaching their Support levels, while the 1D MA50 (blue trend-line) is closing in. Target: 4.200 (the 3.5 Fibonacci extension). ** Please support this idea with your likes and comments, it is the best way to keep it relevant and support me.

