

-
NZDUSD Strong sell signal
- April 13, 2022
- Posted by: Tradingshot Articles
- Category: Forex
No Comments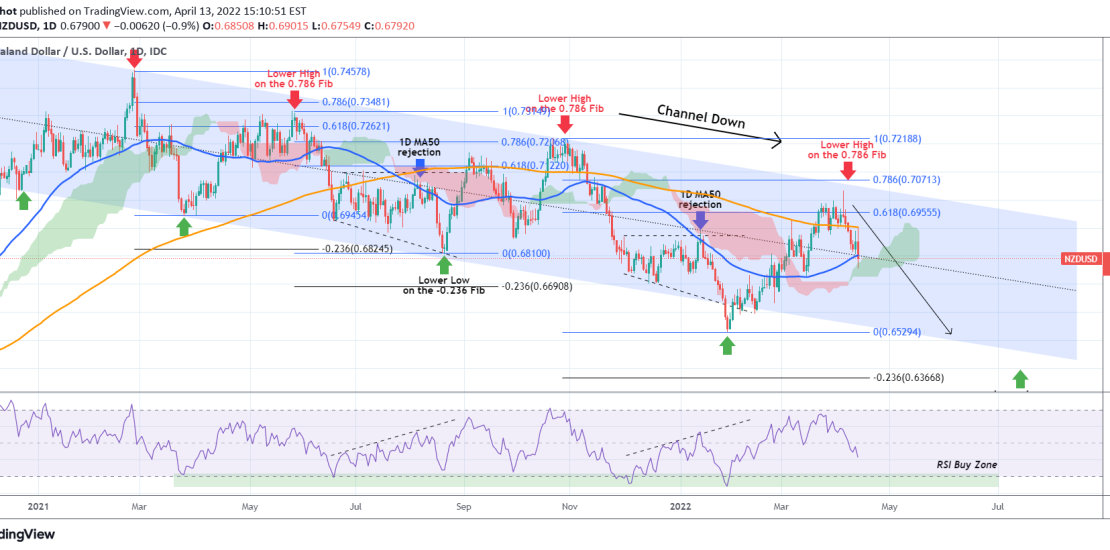
The NZDUSD pair has been trading within a long-term Channel Down since the start of 2021. Our last call on this pair was a buy signal and our 0.7000 target has been hit: The price broke below the Lower Lows trend-line, creating a small divergence and we have to re-adjust our projected Fibs. As
-
EURUSD The 1D MA50 rejection can deliver sub 1.0700 prices.
- April 6, 2022
- Posted by: Tradingshot Articles
- Category: Forex
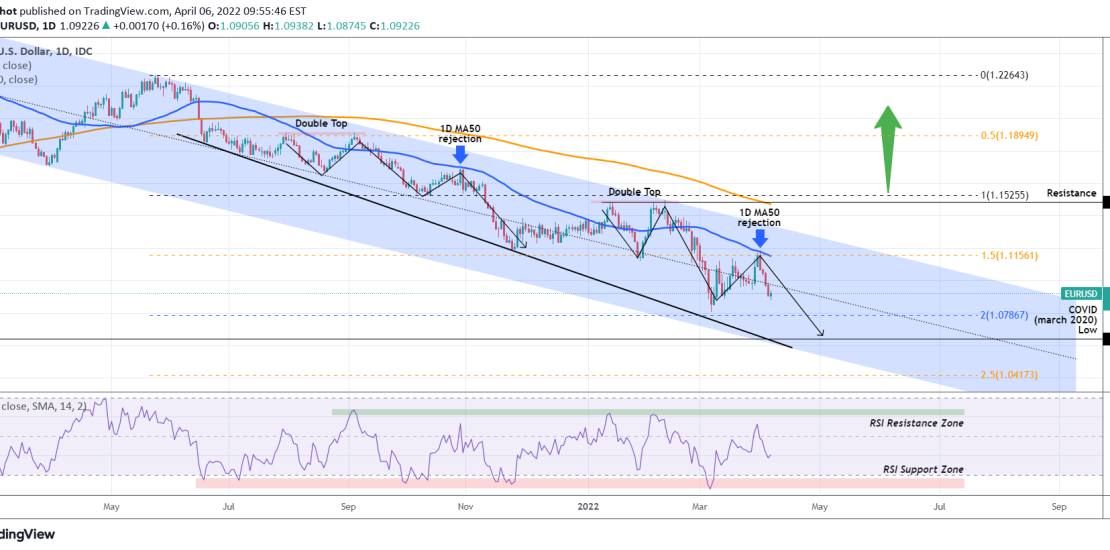
The EURUSD pair got rejected last Thursday on the 1D MA50 (blue trend-line) and as a result it trading today towards the March 07 Low. A new Lower Low within the long-term Channel Up seems imminent as a break below the 1.0810 Low should put the 1.0640 low of the March 2020 COVID melt-down
-
GBPUSD aiming at a new Low within the Bearish Megaphone.
- April 6, 2022
- Posted by: Tradingshot Articles
- Category: Forex
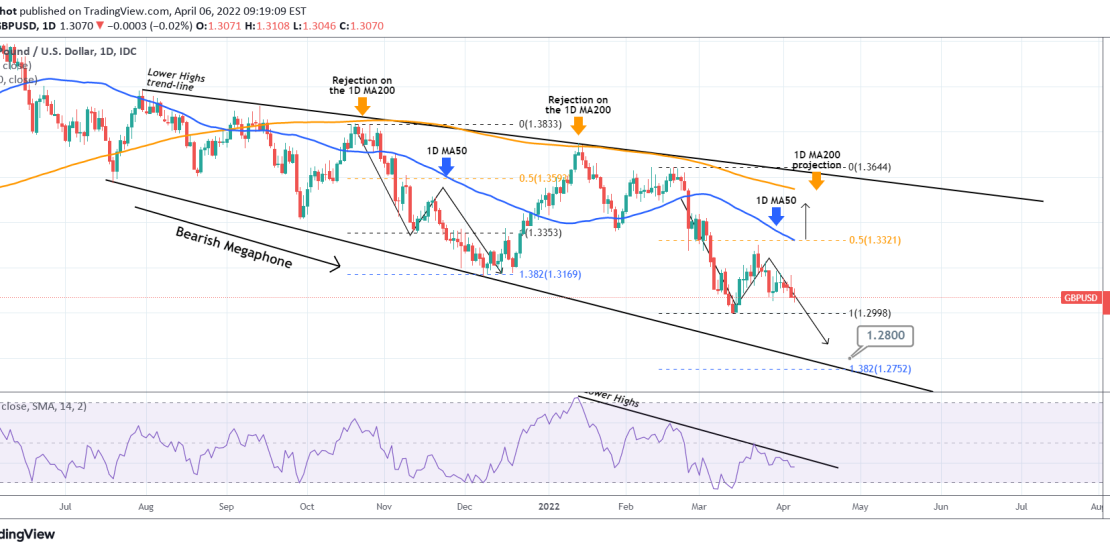
GBPUSD failed to break above the 1D MA50 (blue trend-line) and the 0.5 Fibonacci retracement level last week and as a result the market lost confidence and resumed the long-term bearish trend. That has been within a Bearish Megaphone pattern since July 2021. The selling fractal since February 17 resembles the sequence of late
-
USDJPY Testing a 20 year Resistance. Major Bull Cycle if broken!
- April 6, 2022
- Posted by: Tradingshot Articles
- Category: Forex
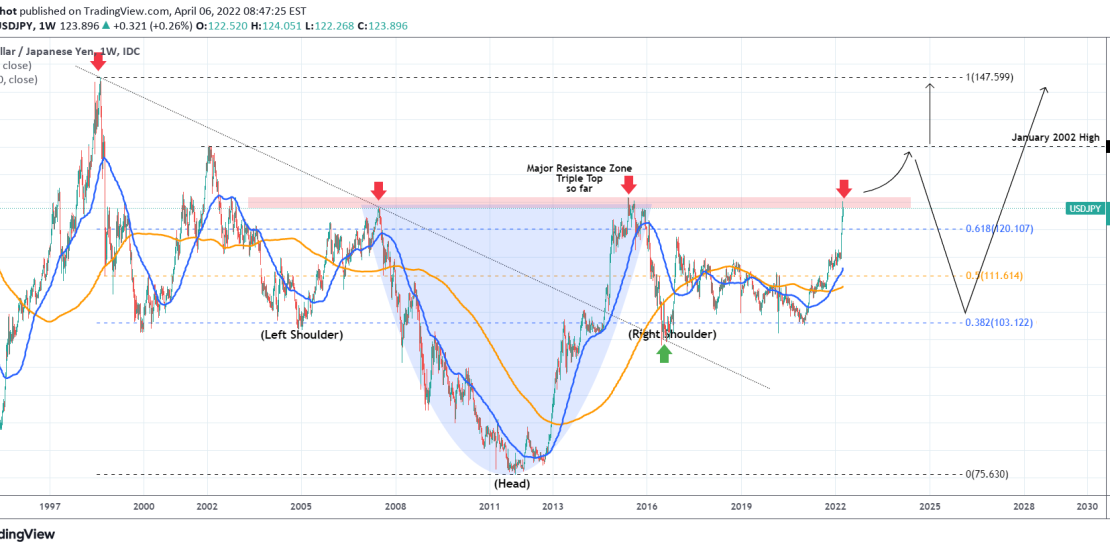
The USDJPY pair has been on the strongest multi-week rise in March-April since the November-December 2016 rally. By doing so, it reached the 125.00 level for the first time since August 2015, which was exactly when the China economic growth slowdown worries hit the market. In fact, the 124.200 – 126.000 band is a
-
EURUSD within a Channel Up short-term
- March 23, 2022
- Posted by: Tradingshot Articles
- Category: Forex
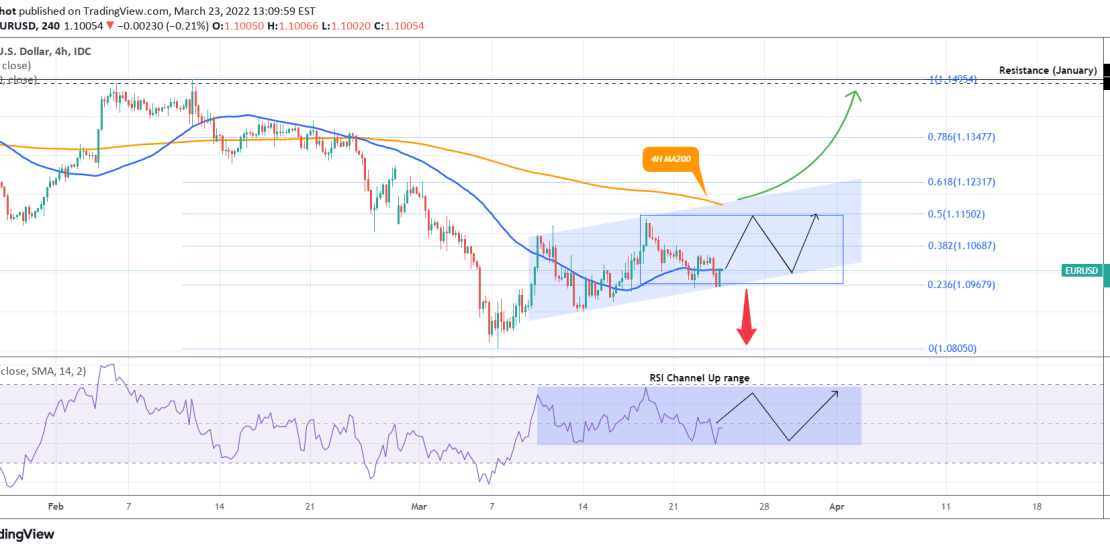
The EURUSD pair has been trading within a short-term Channel Up on the 4H time-frame. The RSI moving sideways within roughly 65.00 – 40.00 is setting up the pace, where we can sell on the Resistance the Higher Highs and buy on its Support the Higher Lows of the price. Basically right now the
-
USDCHF Rejected at the top of its Channel Up.
- March 18, 2022
- Posted by: Tradingshot Articles
- Category: Forex
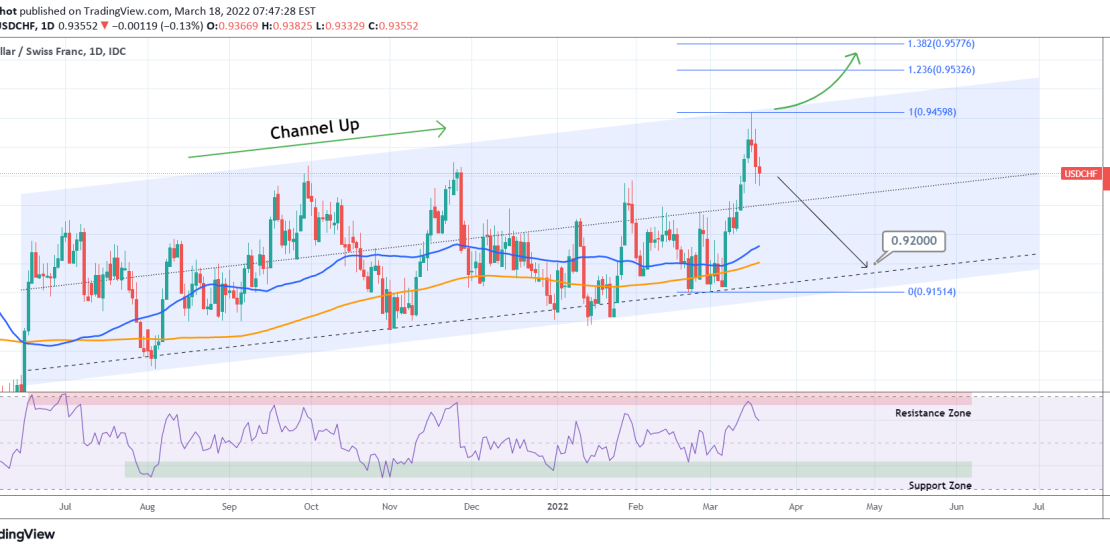
The USDCHF pair has been trading within a Channel Up since June 16 2021. This week it hit and so far got rejected on the Higher Highs (top) trend-line of the Channel. Technically we should see the pull-back extending as low as the Higher Lows zone. A reasonable target is just above the zone
-
USDJPY targeting 120.000 based on this recurring pattern.
- March 11, 2022
- Posted by: Tradingshot Articles
- Category: Forex
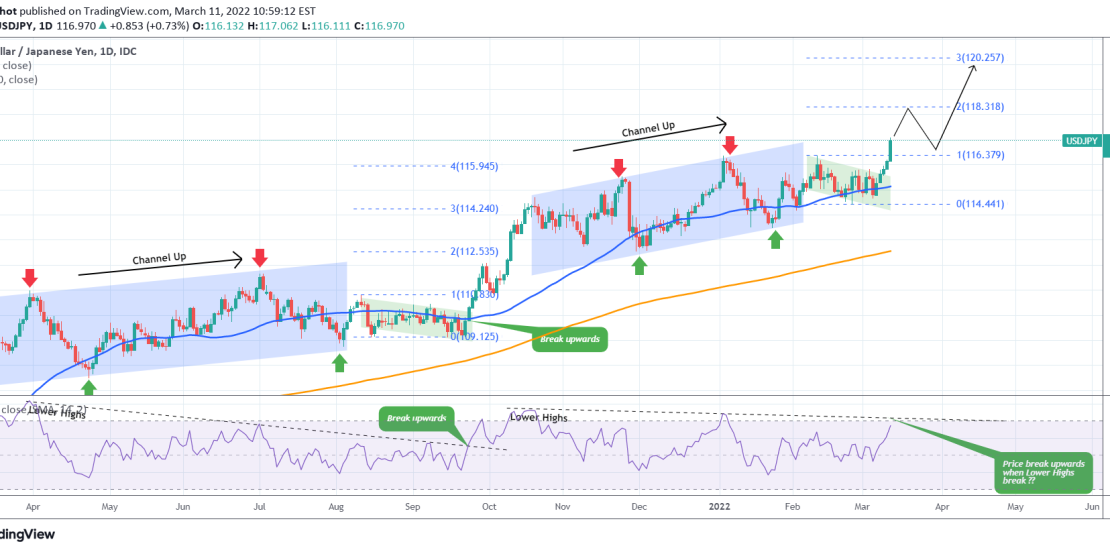
The USDJPY pair is on a strong bullish break-out this week, having recorded an absolute 5 day green 1D candle streak. The 1D MA50 (blue trend-line) is supporting while the 1D RSI is about to break the Lower Highs trend-line started on October 20 2021. Last time the 1D RSI broke above a similar
-
EURUSD Make or break on a multi-year basis?
- March 10, 2022
- Posted by: Tradingshot Articles
- Category: Forex
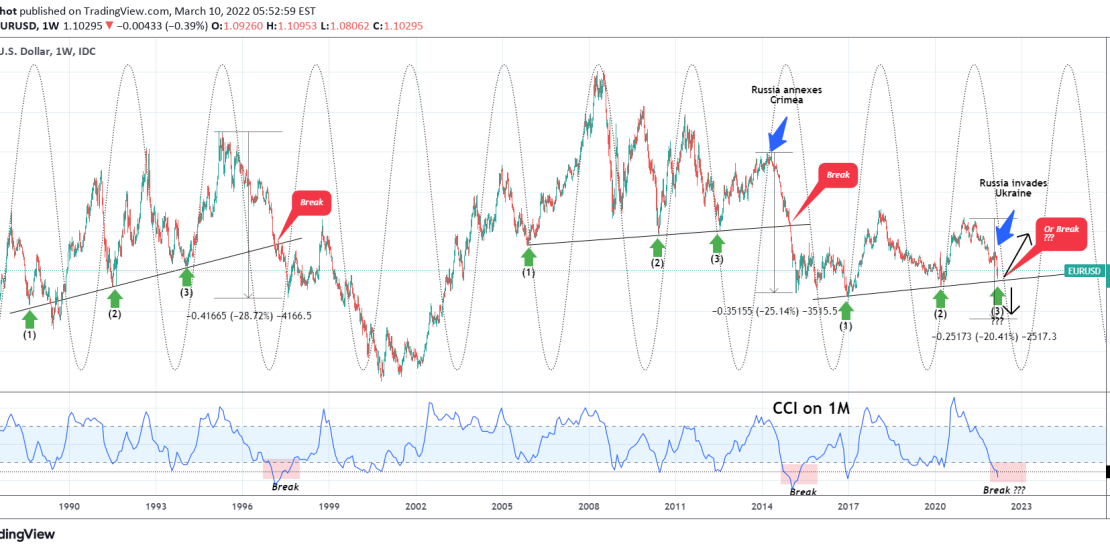
EURUSD has been among the major losers of the Ukraine – Russia war and this has accelerated the bearish trend towards a Higher Lows trend-line that has been holding since late 2016. This chart illustrates the pair on the 1W time-frame but with the CCI indicator below on the 1M (monthly) time-frame. This analysis
-
EURUSD close to its medium-term bottom ahead of ECB & FED Rates
- March 8, 2022
- Posted by: Tradingshot Articles
- Category: Forex
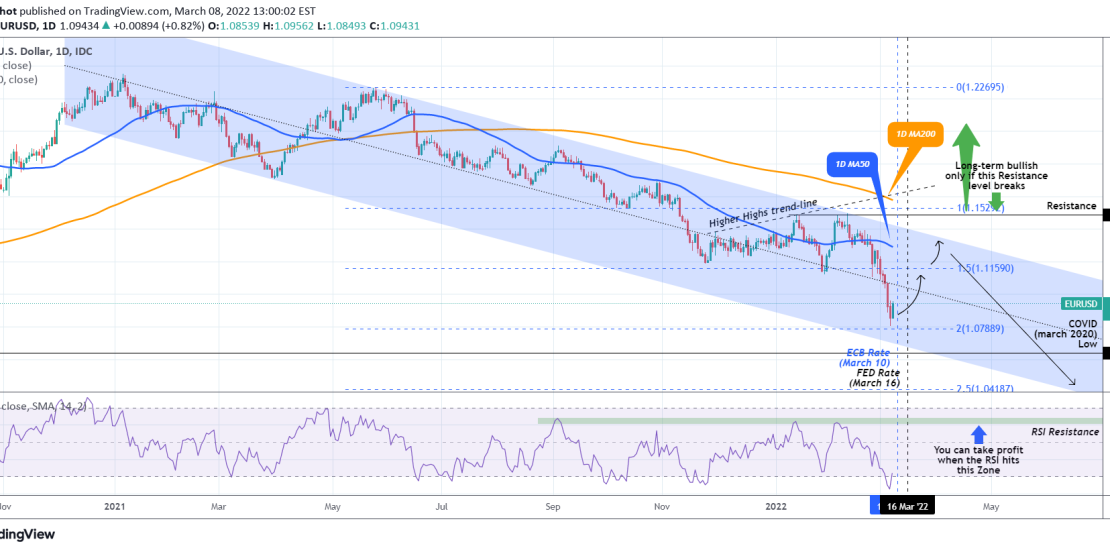
The EURUSD pair has been trading within a Channel Down since 2021. Yesterday the price came to the closest to the bottom (Lower Lows trend-line) of the Channel Down it has been since the March 31 2021 Lower Low and the 1D RSI the lowest since February 18 2020! Those are indications that the
-
WTI OIL in need of a pull-back to the 1D MA50.
- March 8, 2022
- Posted by: Tradingshot Articles
- Category: Forex
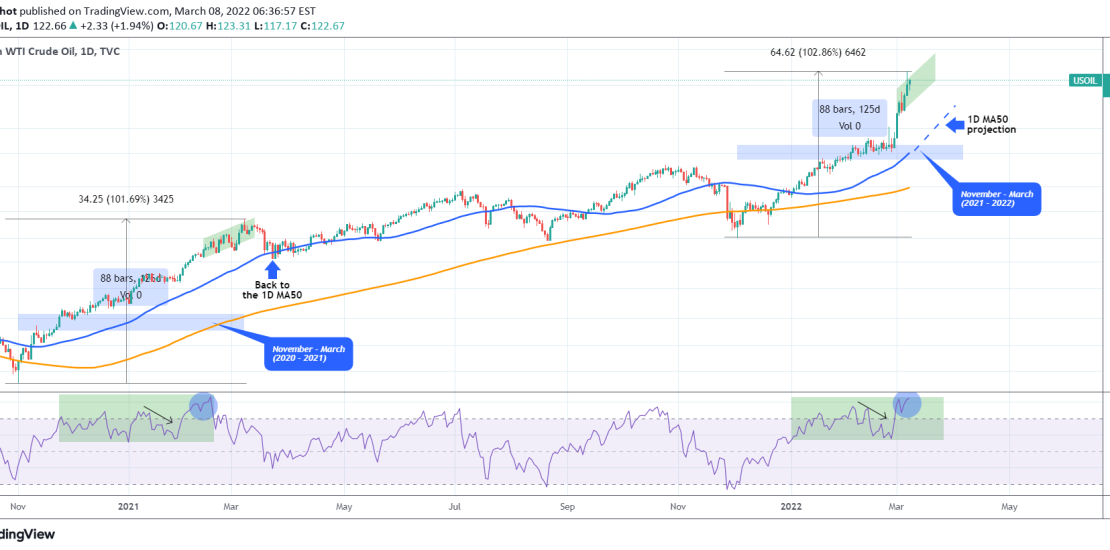
One of the biggest (if not the biggest) winner of the current war between Russian and Ukraine, is Oil. Energy crises are almost a certainty in times of geopolitical conflicts involving major producers. Even though it is tough predicting technically WTI prices while war is ongoing, charting past fractals could give an idea to