- March 11, 2022
- Posted by: Tradingshot Articles
- Category: Forex

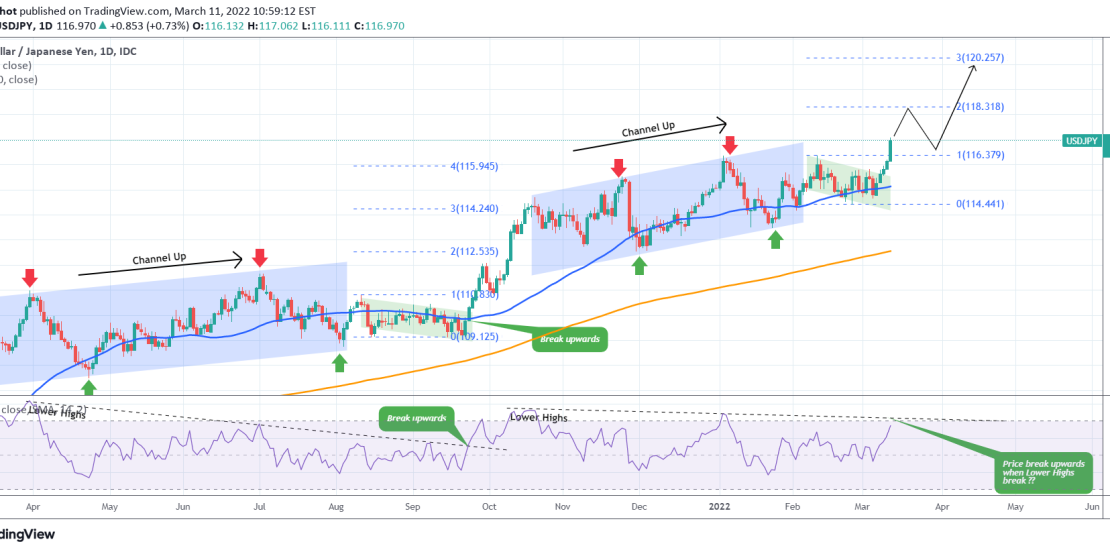
The USDJPY pair is on a strong bullish break-out this week, having recorded an absolute 5 day green 1D candle streak. The 1D MA50 (blue trend-line) is supporting while the 1D RSI is about to break the Lower Highs trend-line started on October 20 2021.
Last time the 1D RSI broke above a similar Lower Highs trend-line, was in September 23 2021. Interestingly enough, it was coming out of a similar Channel Down (green pattern), which was the accumulation phase after a larger Channel Up (blue pattern). The pair then started an aggressive rally that reached the 3.0 Fibonacci extension level before pulling back.
Right now, we are in an identical sequence of patterns (blue Channel Up succeeded by the green Channel Down), with the price breaking this week above the Channel Down. The 3.0 Fibonacci extension is just above the 120.000 mark and that should be the buyers’ target, especially after confirmation break-out of the RSI above its Lower Highs trend-line.
Tradingview link:

