

- March 10, 2022
- Posted by: Tradingshot Articles
- Category: Forex
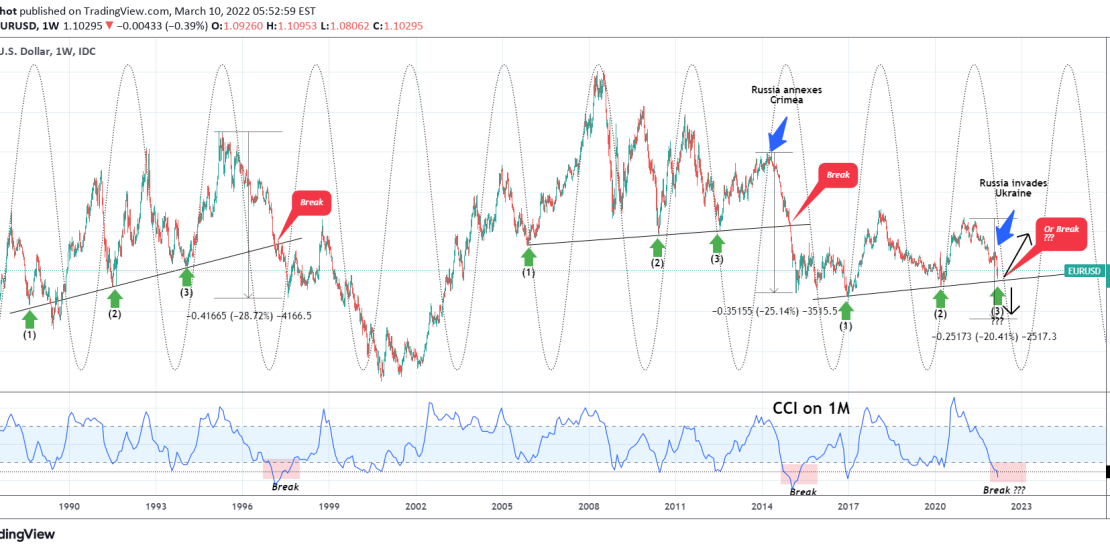
EURUSD has been among the major losers of the Ukraine – Russia war and this has accelerated the bearish trend towards a Higher Lows trend-line that has been holding since late 2016.
This chart illustrates the pair on the 1W time-frame but with the CCI indicator below on the 1M (monthly) time-frame. This analysis manages to display the pair’s long-term cycles and a very distinct pattern that is unfolding for the 3rd time in more than 3 decades.
As you see every prior Higher Lows trend-line held on 3 occasions until a strong break downwards occurred that pushed EURUSD to Lower Lows aggressively. With the price now at its closest(almost on) to the Higher Lows trend-line since March 2020 (COVID crash), the key question is, which part of the Cycle are we on? Higher Low (3) or on the verge of breaking downwards?
In Legs terms this looks like Higher Low (3). The 1M CCI though shows that we may be on the verge of a Break as it has broken below -150.00 and every time the pair has done so in the past 30 years, the Break below the Higher Lows trend-line occurred (exception December 2016).
A break below the Higher Lows could complete at least a -20% drop from the previous top of December 2020, as the previous two breaks delivered roughly -25% and -28% corrections respectively. On the other hand, if this is Higher Low (3) and it holds, this can be the start of a very aggressive multi-year rise to new Highs.
Tradingview link:
https://www.tradingview.com/chart/EURUSD/30tp06x8-EURUSD-Make-or-break-on-a-multi-year-basis