
-
BITCOIN bringing rally memories to ETHEREUM??
- September 13, 2020
- Posted by: Tradingshot Articles
- Category: Cryptocurrency
No Comments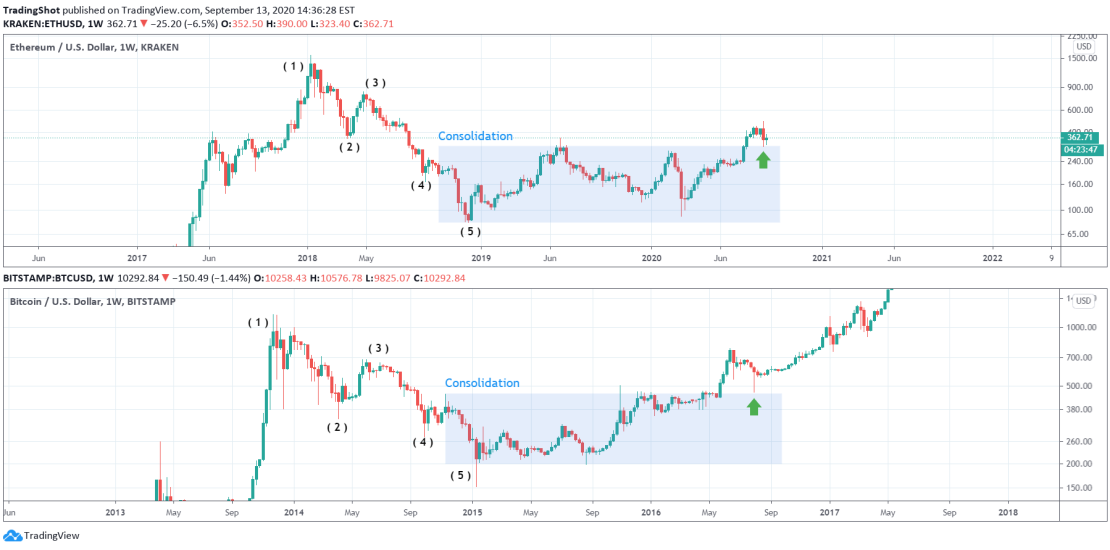
This is an interesting find I came across while comparing ETH’s current cycle on the 1W chart to BTC’s previous (2014 – 2017) Cycle. As you see Ethereum, not only follows Bitcoin’s Bear Market structure but also the consolidation that took place after, which led to the Bull Market rally. When that consolidation broke to
-
BITCOIN How many 1D candle closings above $10000 can we take?
- September 10, 2020
- Posted by: Tradingshot Articles
- Category: Cryptocurrency
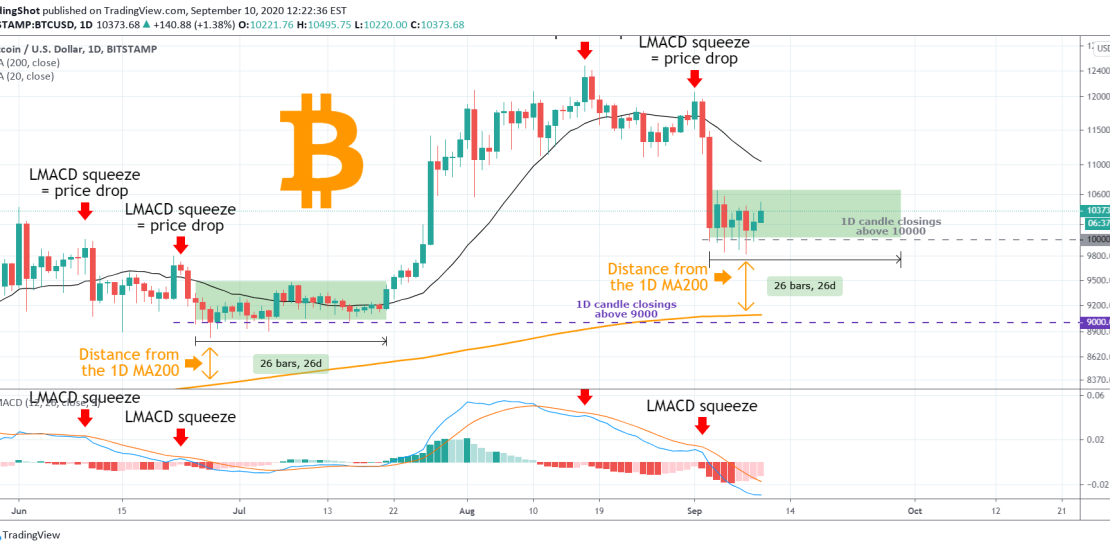
You should have noticed by now that since the September 03 drop, Bitcoin has been consolidating around the $10000 mark. But what may be of particular importance, is the fact that this consolidation never closes a daily candle below that (10000) level. Can this be a coincidence and if not what does it tell
-
BITCOIN The most critical days of the year CAUTION !!!
- September 4, 2020
- Posted by: Tradingshot Articles
- Category: Cryptocurrency
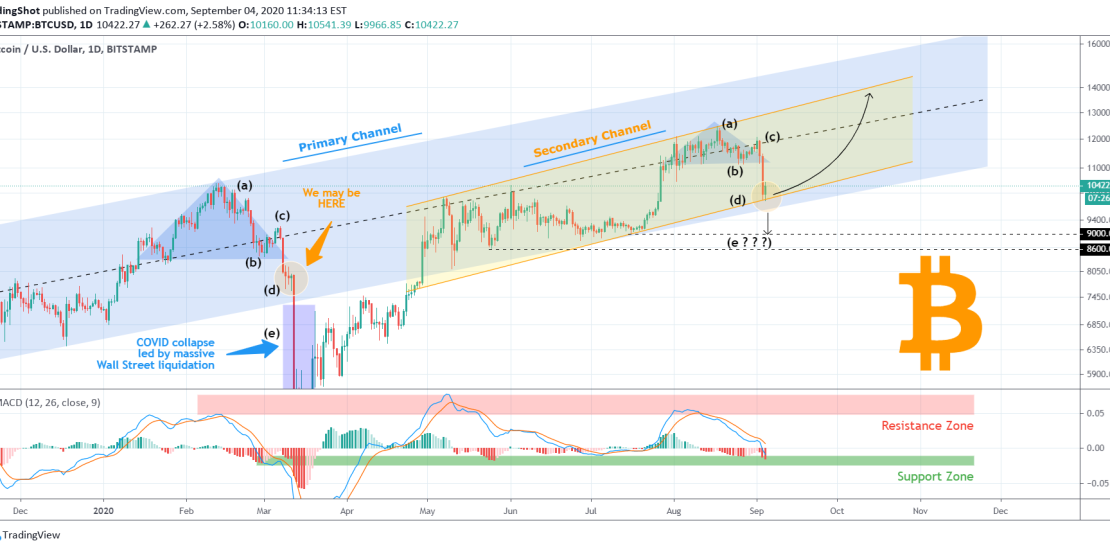
The title may sound a bit dramatic but it is true. Bitcoin is on critical crossroads as it maintains trading within the long-term Channel Up formations but any break lower endangers the effort made after the COVID flash crash. ** Two Channels ** As you see on the chart, there are two main patterns
-
BITCOIN Channel Up and Head and Shoulders = combo for a rally?
- September 2, 2020
- Posted by: Tradingshot Articles
- Category: Cryptocurrency

Fractal B is replicating the waves of Fractal A almost religiously. What’s interesting, is that the price action since August 03 has formed a Head and Shoulders pattern and this has given me the following idea. I looked more into the price action since the March recovery and discovered that (roughly) similar Head and
-
BITCOIN This fractal shows $17000 by the end of the year.
- August 9, 2020
- Posted by: Tradingshot Articles
- Category: Cryptocurrency
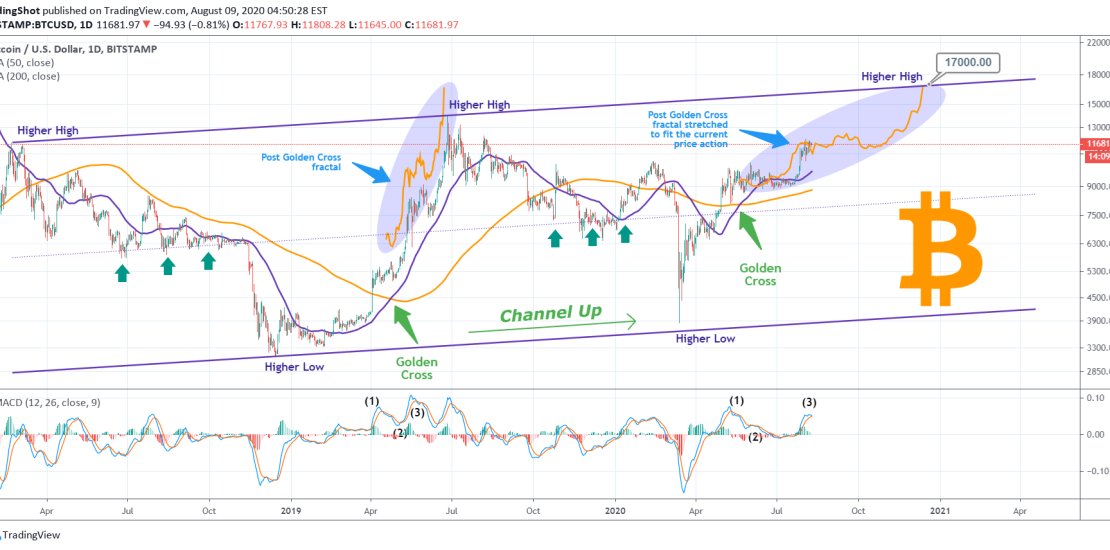
On March I published the following idea, that Bitcoin’s underlying pattern was a Channel Up: In my opinion, that made (and of course still makes) perfect sense, as after the previous Bear Market ended, BTC is in search of an accumulation platform to take it to the next parabolic Bull Phase. On May I
-
ETHBTC Time to sell it
- August 5, 2020
- Posted by: Tradingshot Articles
- Category: Cryptocurrency
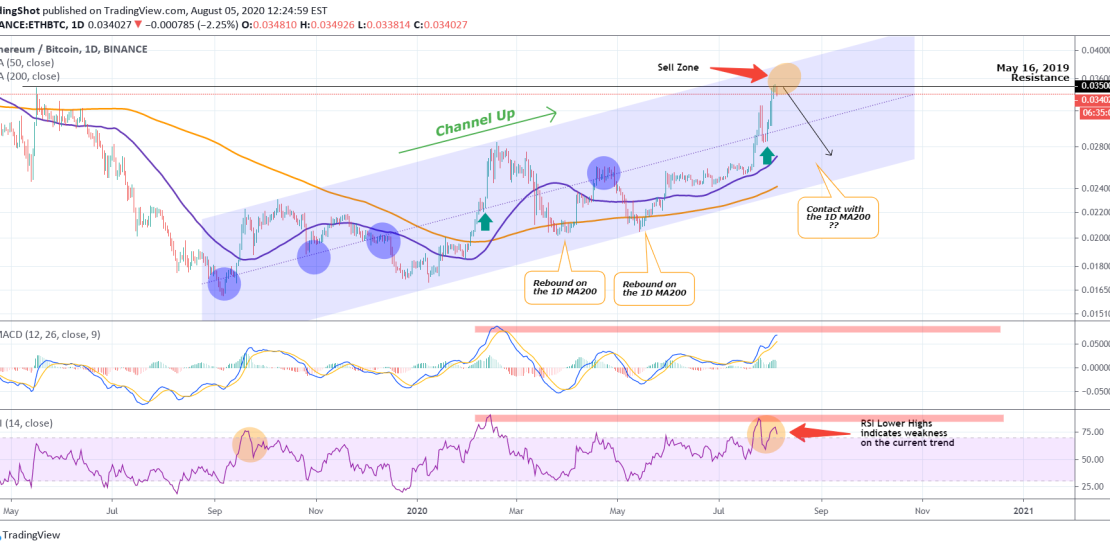
Two weeks ago when Ethereum was trading at $265, I called for a buy as seen on the idea below: It since broke $400 and now I shift my focus on the ETHBTC pair, which is giving me a Sell Signal: Pattern: Channel Up on 1D. Signal: Sell as the price hit the 0.035
-
BITCOIN Reached the 12k Target. $14000 is now next!
- August 3, 2020
- Posted by: Tradingshot Articles
- Category: Cryptocurrency
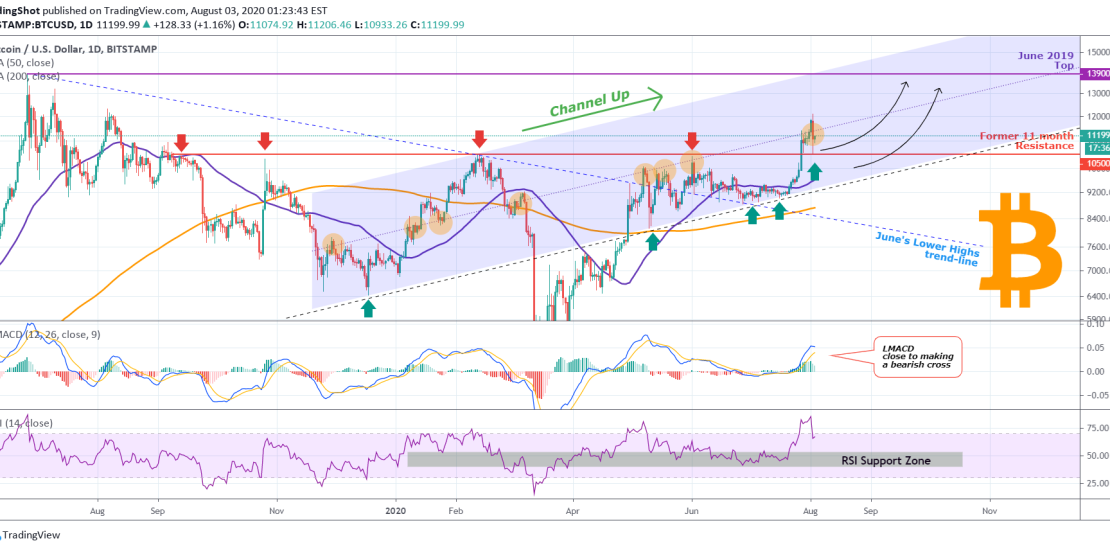
Bitcoin reached the $12000 Target level I set on my previous analysis with relative ease as it followed this fractal shown below: What’s next? In my opinion and based on all relative trend-lines involved, it is the $13900 Top made in June 2019! ** Before we start, please support this idea with your likes
-
BITCOIN Trading sideways post-Halving is the norm.
- July 15, 2020
- Posted by: Tradingshot Articles
- Category: Cryptocurrency
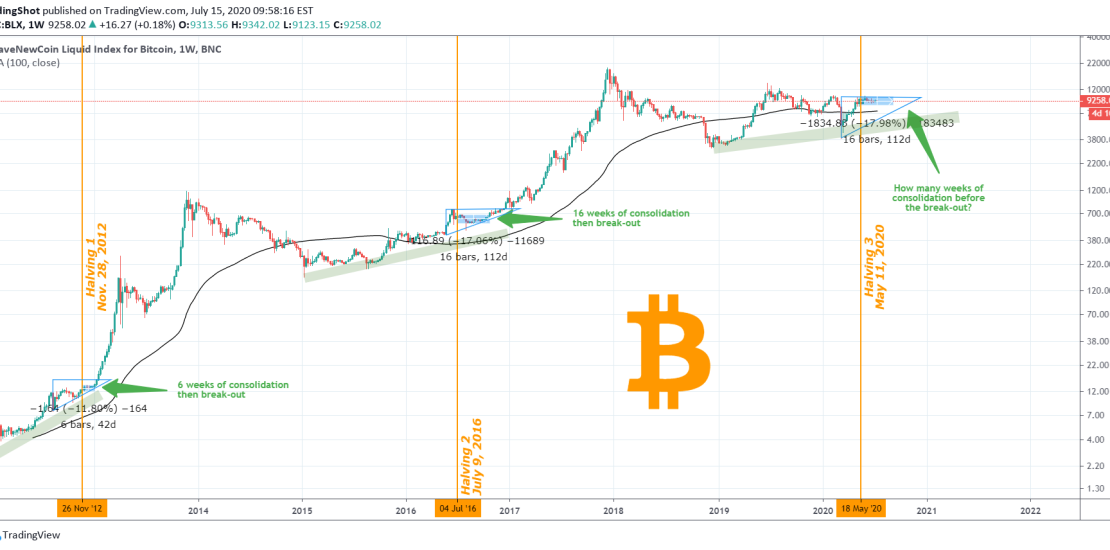
I just want to set all the confusion straight regarding Bitcoin’s ranged price action since May. After each BTC Halving, the price always consolidated for several weeks before a bullish break-out from the range. To put this into perspective, following Halving 1 (November 28, 2012), BTC consolidated for 6 weeks within a roughly 12%
-
BITCOIN $9400 hit. Next targets on the short-term.
- July 8, 2020
- Posted by: Tradingshot Articles
- Category: Cryptocurrency
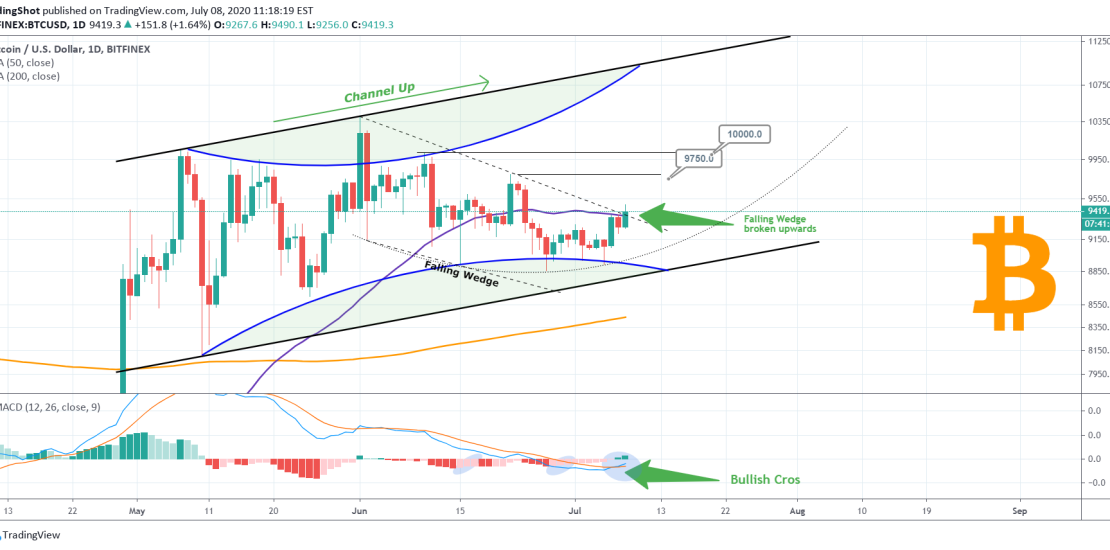
Bitcoin eventually followed the short-term formation I posted a week ago, and hit the $9400 target. The Falling Wedge has been broken to the upside and since the price is still within the Channel Up pattern on the 1D chart, it turns bullish on the short-term. On top of that the LMACD has made
-
Is CHAINLINK about to break upwards?
- June 17, 2020
- Posted by: Tradingshot Articles
- Category: Cryptocurrency
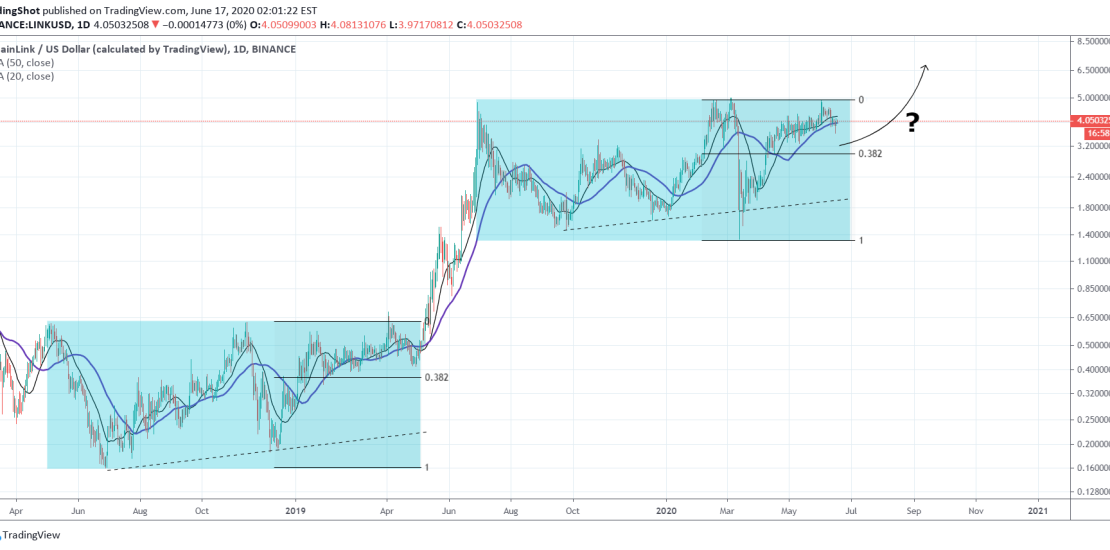
A rather simple chart but what do you make of this? LINKUSD pattern since June 2019 resembles the consolidation of May 2018 – April 2019. This consolidation pattern aggressively broke upwards (along with the majority of cryptos) to form the June top. The key here is the 0.382 Fibonacci. As long as it holds,
