

- August 9, 2020
- Posted by: Tradingshot Articles
- Category: Cryptocurrency
On March I published the following idea, that Bitcoin’s underlying pattern was a Channel Up:

In my opinion, that made (and of course still makes) perfect sense, as after the previous Bear Market ended, BTC is in search of an accumulation platform to take it to the next parabolic Bull Phase.
On May I updated that idea, calling that the consolidation at the time was a signal of an upcoming bullish break-out:

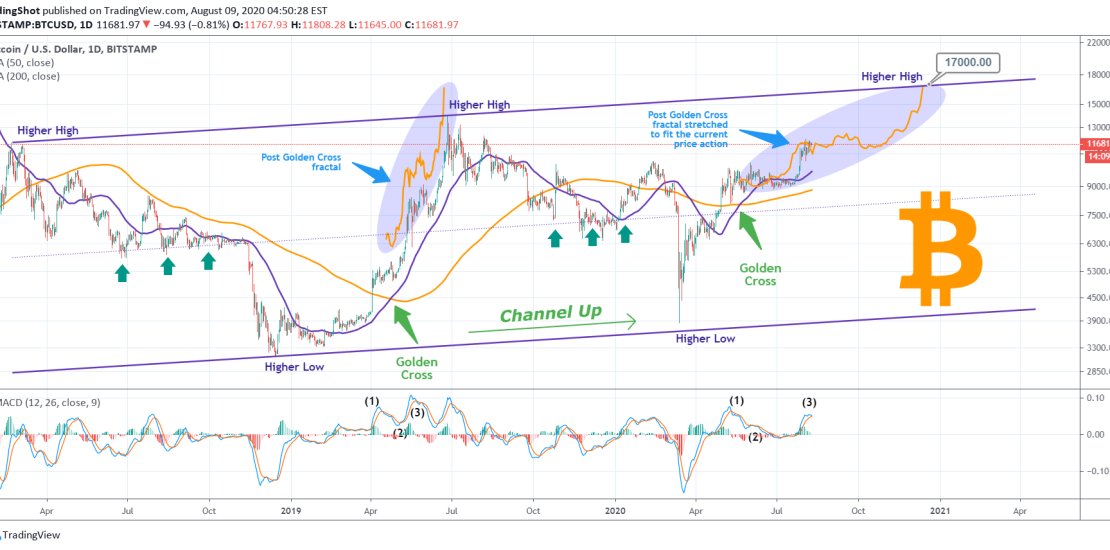
** The current post-Golden Cross fractal **
What I am focusing on this time (always within the Channel Up framework) is the price action after the Golden Cross in the previous Higher Low – Higher High run (December 2018 – June 2019) and the current (March 2020 – today). As you see the 2019 fractal when applied on the post May 2020 price action, it shows a smooth rise to the Higher High trend-line of the Channel Up at around $17000. What’s more interesting is that it times it at the end of the year. If it plays out perfectly, expect a consolidation until early November before the final bull run.
Do you think that fractal can play out? Or have something else in mind? Feel free to share your work and let me know in the comments section!
Please like, subscribe and share your ideas and charts with the community!
!! Donations via TradingView coins also help me a great deal at posting more free trading content and signals here !!
BONUS MATERIAL Take a look at how fractals can give successful indications even on smaller time-frames:
