- September 5, 2019
- Posted by: Tradingshot Articles
- Category: Commodities
No Comments

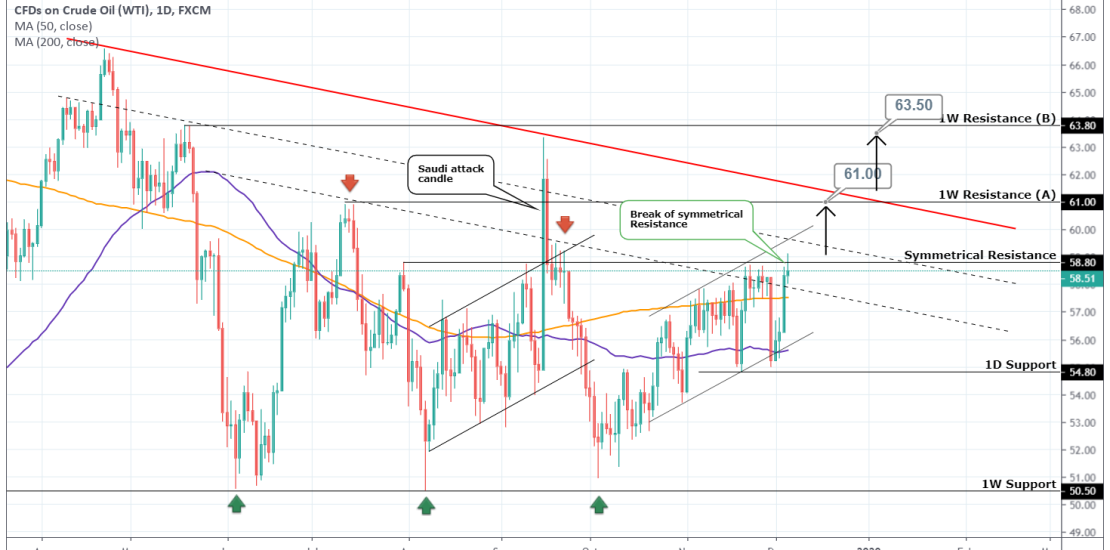
Pattern: 1D Channel Up.
Signal: Bullish as the price broke the 58.80 Symmetrical Resistance, which (excluding the Saudi attack on September 16th) has been holding since July.
Target: 61.00 (1st 1W Resistance) and if the Lower High trend line (red bold) of the Descending Triangle breaks, 63.50 (2nd 1W Resistance).
See how accurate the 1W Descending Triangle has been on my last Support Buy:
Tradingview link:
https://www.tradingview.com/chart/USOIL/GwoKYhSJ-WTI-OIL-Bullish-Trading-plan

