

- May 14, 2020
- Posted by: Tradingshot Articles
- Category: Commodities
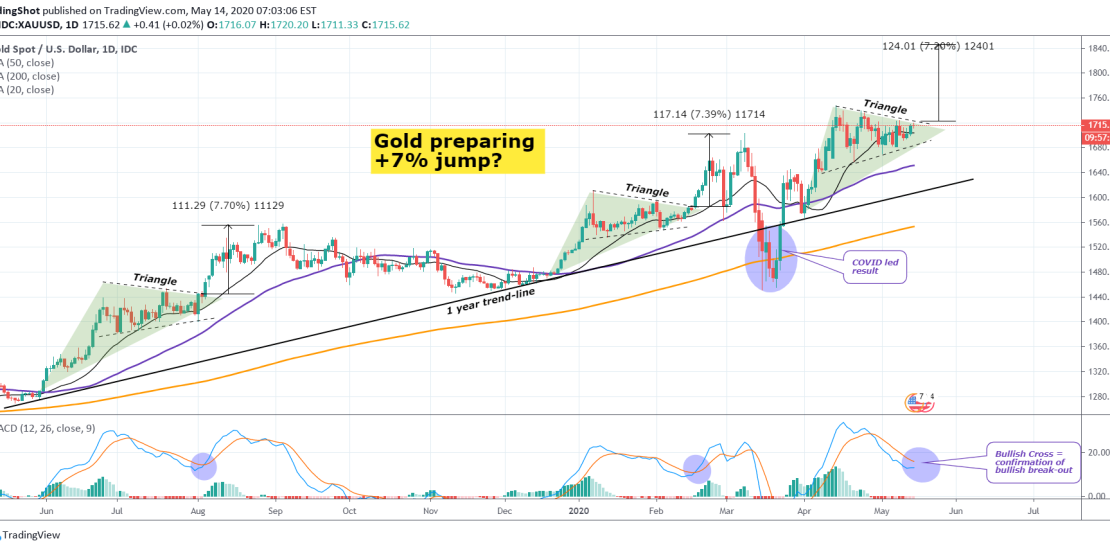
This is based on the long-term trend starting 1 year ago (exactly May 2019). I want your opinion on this very interesting pattern I found.
As you see and probably most are well aware of, Gold has been trading within a Triangle since early April on the 1D chart, with the MACD close to forming a Bullish Cross.
The very same Triangle has been formed twice after the last two tests on the 1 year trend-line (excluding of course the break-out on March 13th which was fueled by the COVID sell-off on the stock markets). What followed after the Triangle broke upwards was a +7% bullish extension. In total the whole move from the last Higher Low of the Triangles was +10%.
The MACD cross on the Triangles’ breakouts was identical. Does this mean Gold is about to make a +7% jump? Now this is a long term projection and many parameters have effect on such estimations. I am not trying to inject euphoria on Gold buyers or scare sellers, I prefer trading smaller time-frames. Just pointing out a technical occurrence.
I am very curious what you think about that chart. Feel free to share your work and let me know in the comments section!
Please like, subscribe and share your ideas and charts with the community!
Tradingview link:
https://www.tradingview.com/chart/XAUUSD/JAQuZ5jc-Is-GOLD-preparing-a-7-rise