

-
HKDJPY Buy Signal
- December 20, 2019
- Posted by: Tradingshot Articles
- Category: Forex
No Comments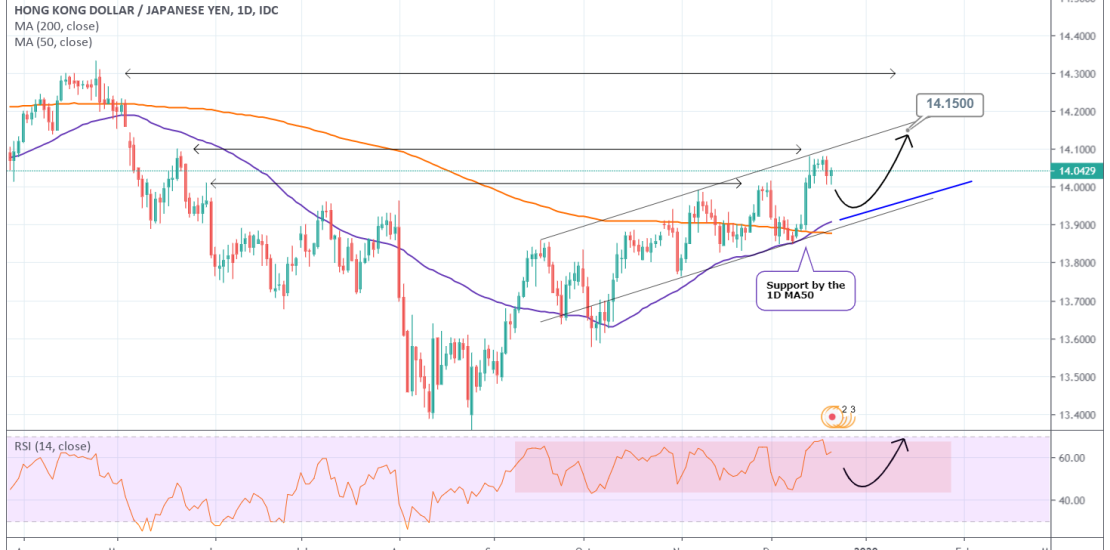
Pattern: 1D Channel Up. Signal: Bullish on the next Higher Low (typically the 1D MA50 supports and the RSI goes within 50.000 – 45.000). Target: 14.1500 (projected Higher High of the pattern). Tradingview link: https://www.tradingview.com/chart/HKDJPY/8nys7YJz-HKDJPY-Buy-Signal
-
GBPJPY Sell Signal
- December 13, 2019
- Posted by: Tradingshot Articles
- Category: Forex
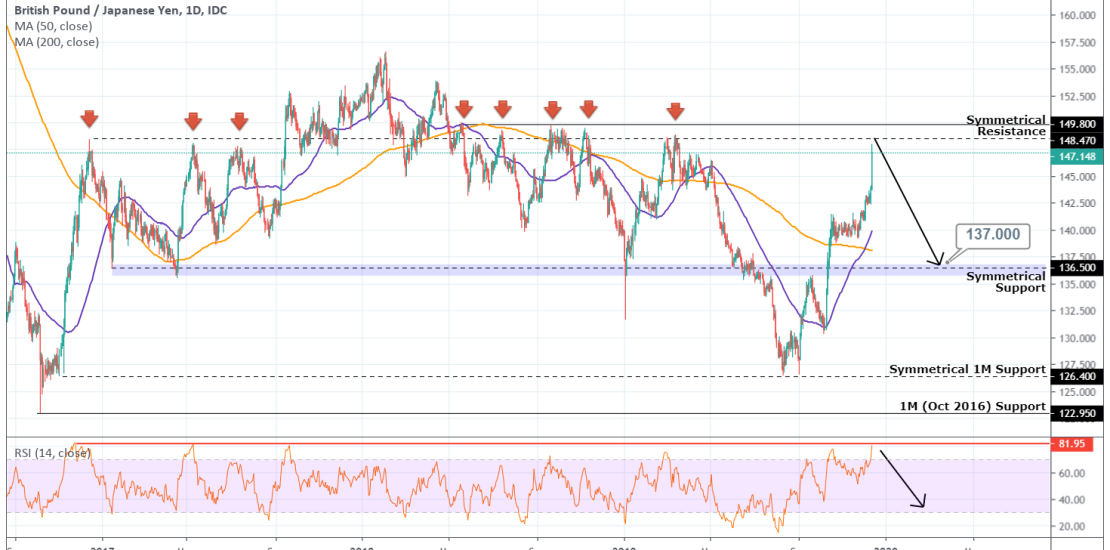
Pattern: Parabolic rise on 1D. Signal: Bearish as it is approaching a Symmetrical Resistance level (rejected the price 8 times since 2016) with the RSI on 3 year highs. Target: 137.000 (Symmetrical Support). *Such long term symmetries are useful and quite accurate. I have successfully implemented this approach on my last GBPJPY buy signal: Tradingview
-
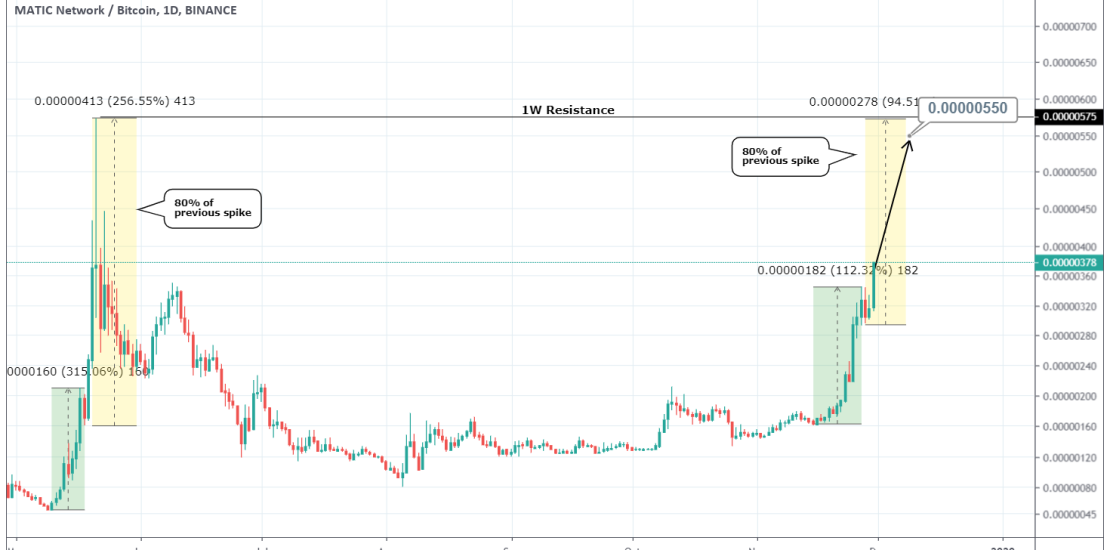
MATICBTC Why surprised? This should have been expected.
- December 11, 2019
- Posted by: Tradingshot Articles
- Category: Cryptocurrency
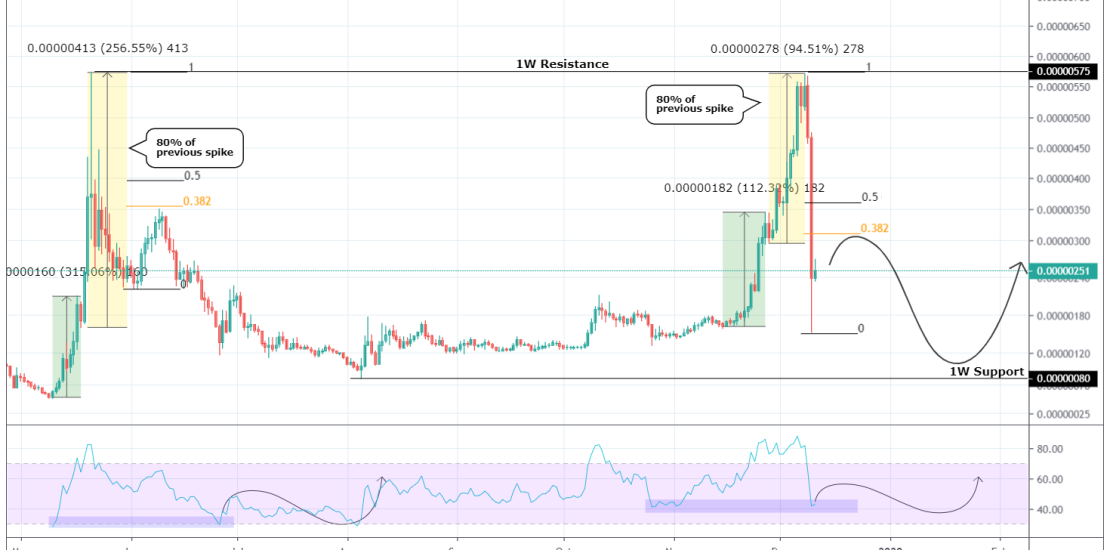
MATIC left a whole lot of people wondering why it was massively sold two days ago. Well the answer is simple, it was rejected on the 1W Resistance. It was a move perfectly calculated on the trade idea seen below: The rise prior to the rejection was easily seen on an early stage: So what
-
XAUUSD Buy signal (and continuation level)
- December 11, 2019
- Posted by: Tradingshot Articles
- Category: Commodities
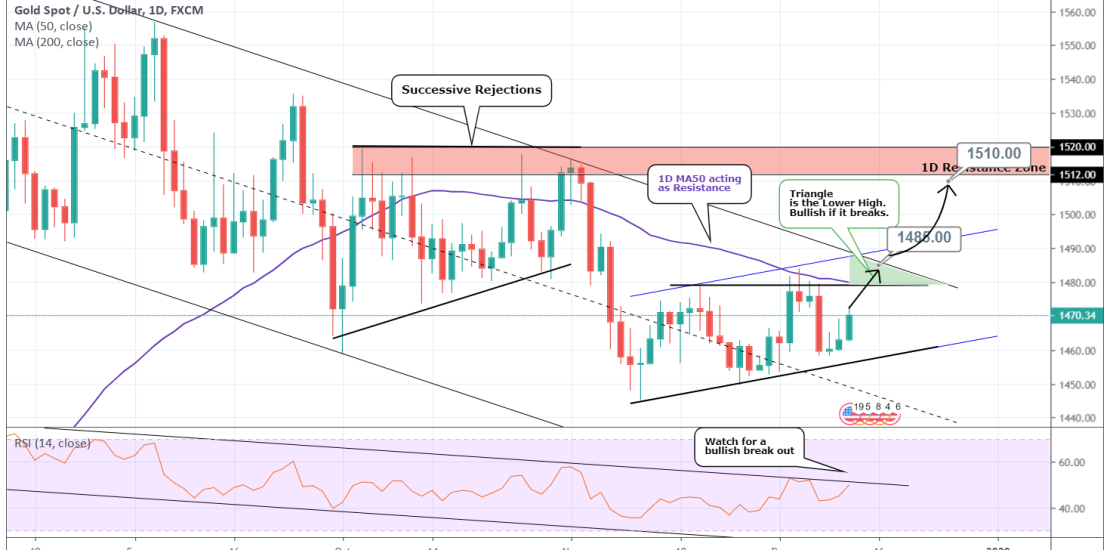
Pattern: Channel Up on 1D (blue channel). Signal: Bullish as the price is rebounding on the Higher Low. Target: 1485 (Lower High of 1W Channel Down). * Observe the 1D RSI, if it breaks above its Channel Down we may have a bullish break out of the 1W Channel Down. Basically is the Green Triangle
-
ETHEREUM is a 2nd chance for those who missed out on BITCOIN
- December 10, 2019
- Posted by: Tradingshot Articles
- Category: Cryptocurrency
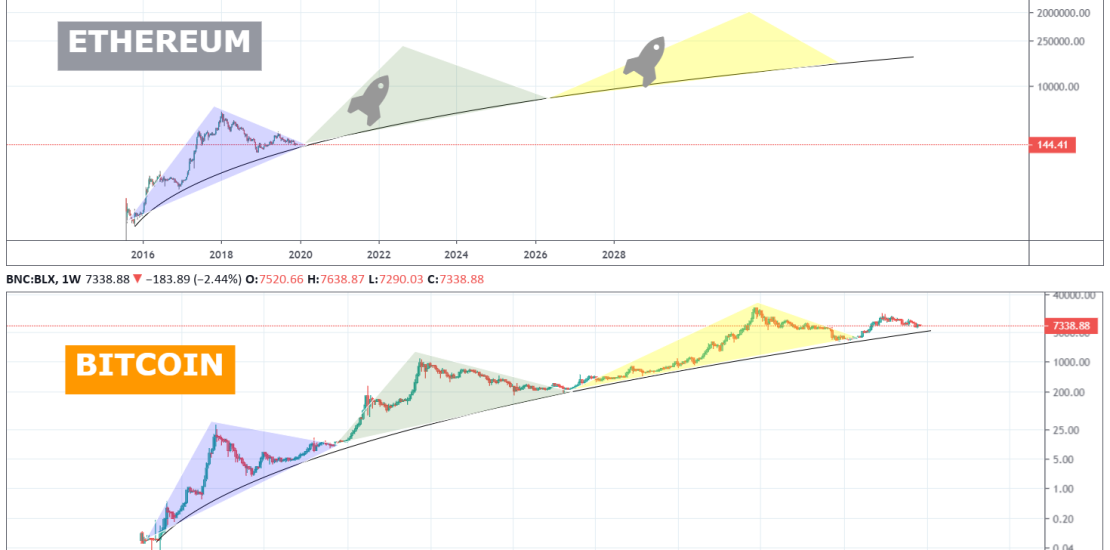
I have been into ETHUSD for a very long time and was always interested at the fundamental similarities with BTCUSD. I always thought that Ethereum was repeating Bitcoin’s first Cycle and even published this study: I am not going to go into much detail on this analysis. The candle action resemblance of ETH with BTC’s
-
BITCOIN Will 2020 be the year of recovery and accumulation?
- November 30, 2019
- Posted by: Tradingshot Articles
- Category: Cryptocurrency
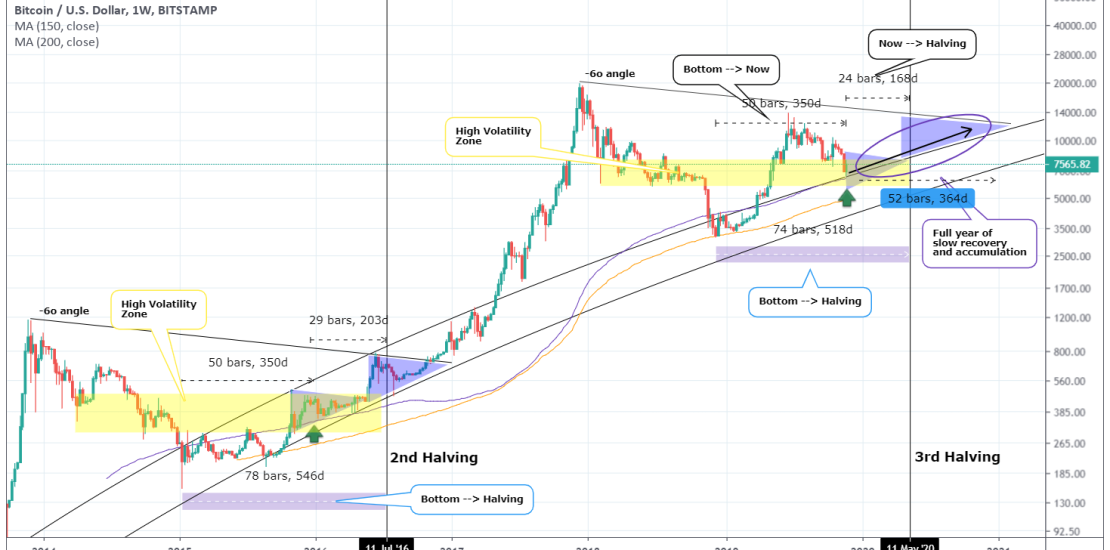
I have been asked by certain enthusiastic followers (I thank everyone for the support), to make an update on the following chart: *$6000 bottom while everyone was bullish to 20K* As you see it was late September with Bitcoin trading at $10000 and everyone pretty bullish when this idea was published talking about a potential
-
MATICBTC All targets hit. One last spike left?
- November 30, 2019
- Posted by: Tradingshot Articles
- Category: Cryptocurrency
This is a follow up of the last MATICBTC call where both Targets got hit (0.00000268 and 0.00000350) as you can see below: Now I have found an interesting correlation for those of you who want to take some more risk. The similarities with the May parabolic rise are strong. That sequence is divided
-
$6500 on BITCOIN there you have it! Final flush and up we go!
- November 25, 2019
- Posted by: Tradingshot Articles
- Category: Cryptocurrency
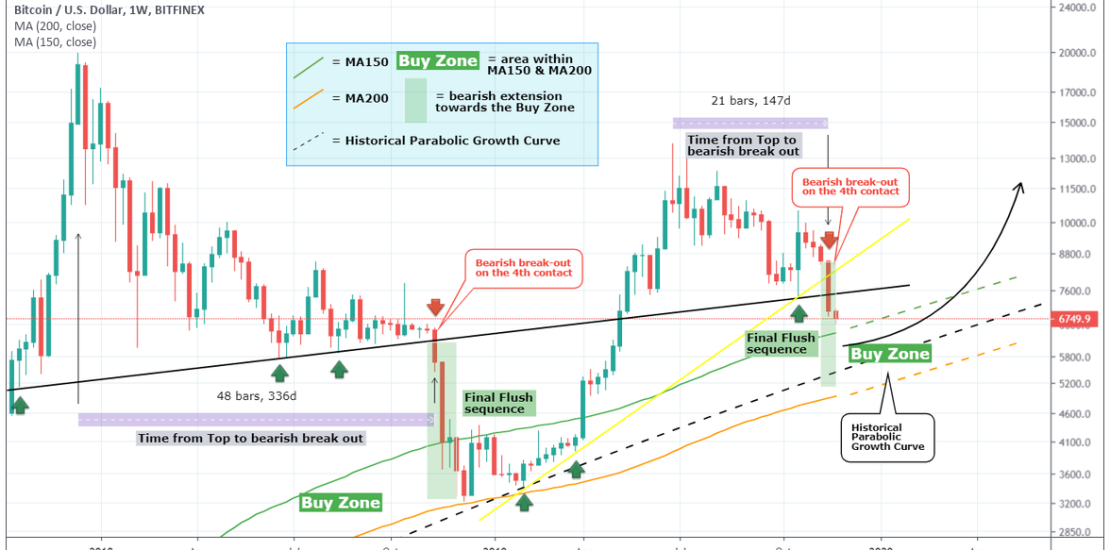
Well eventually all projections for a $6500 price on Bitcoin have proved to be correct. The following study in particular came incredibly close to estimating 6500 on December 1: *The 4th contact sell-off* What I want to focus on today is an analysis I posted 5 days ago (see the chart right below) when
-
WTI OIL Neutral sentiment. Trade the break-out.
- November 21, 2019
- Posted by: Tradingshot Articles
- Category: Commodities
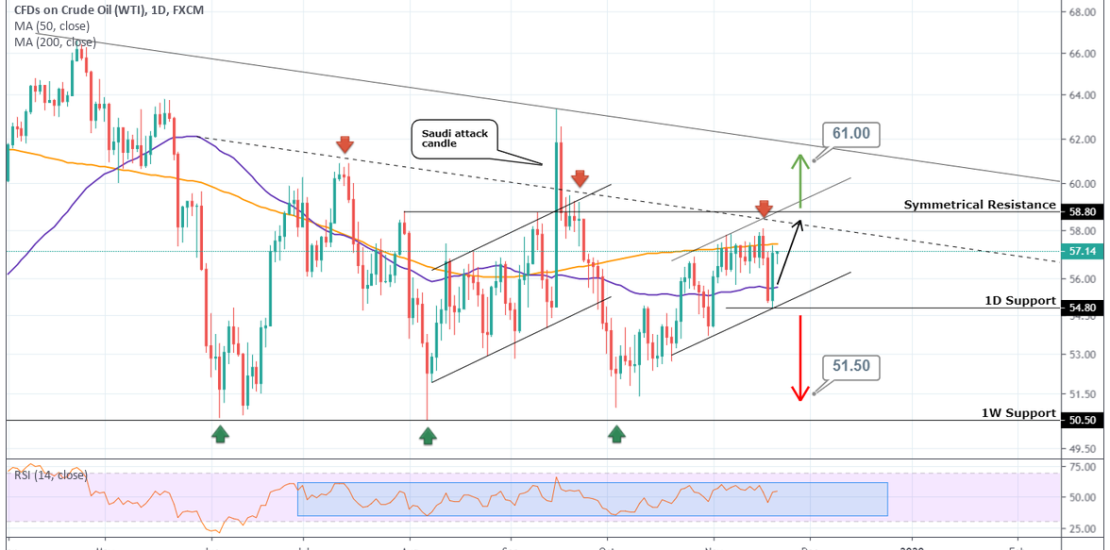
Pattern: 1W Descending Triangle . Signal: Bullish within the 1D Channel Up. Neutral outside so trade the break out: (A) Bullish above the 58.80 Symmetrical Resistance, (B) Bearish below the 54.80 1D Support. Target: Within the 1D Channel Up it is always the 58.80 Resistance. Outside is (A) = 61.00, (B) = 51.50. See how
-
AUDNZD Sell Signal
- November 14, 2019
- Posted by: Tradingshot Articles
- Category: Forex
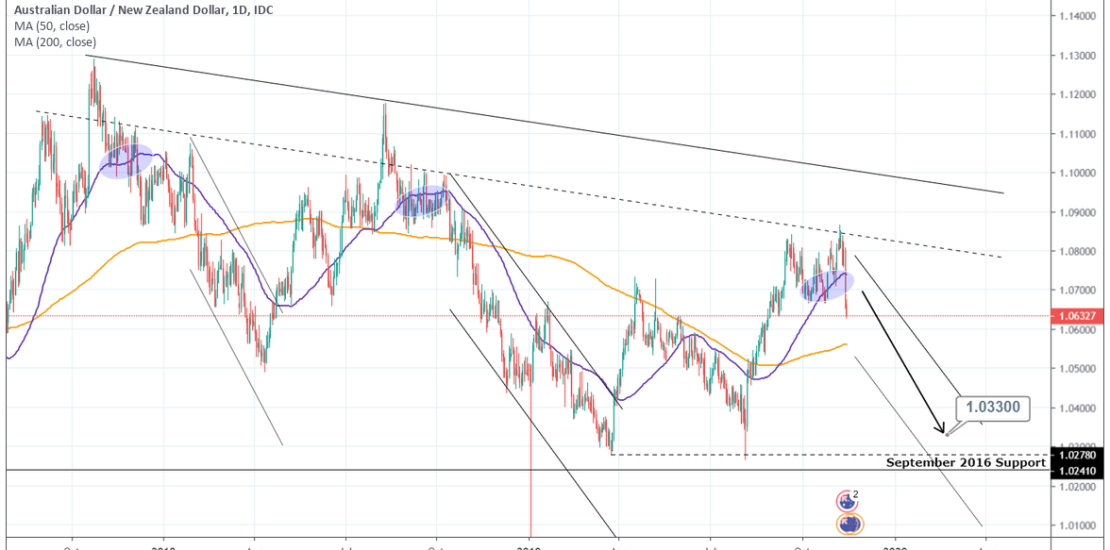
Pattern: 1M Descending Triangle. Signal: Bearish as the price broke below the D MA50 on a strong candle. Target: 1.03300 (just above the 1M Support). Tradingview link: https://www.tradingview.com/chart/AUDNZD/PUklChTV-AUDNZD-Sell-Signal