

-
GBPEUR Sell Signal
- January 14, 2020
- Posted by: Tradingshot Articles
- Category: Uncategorized
No Comments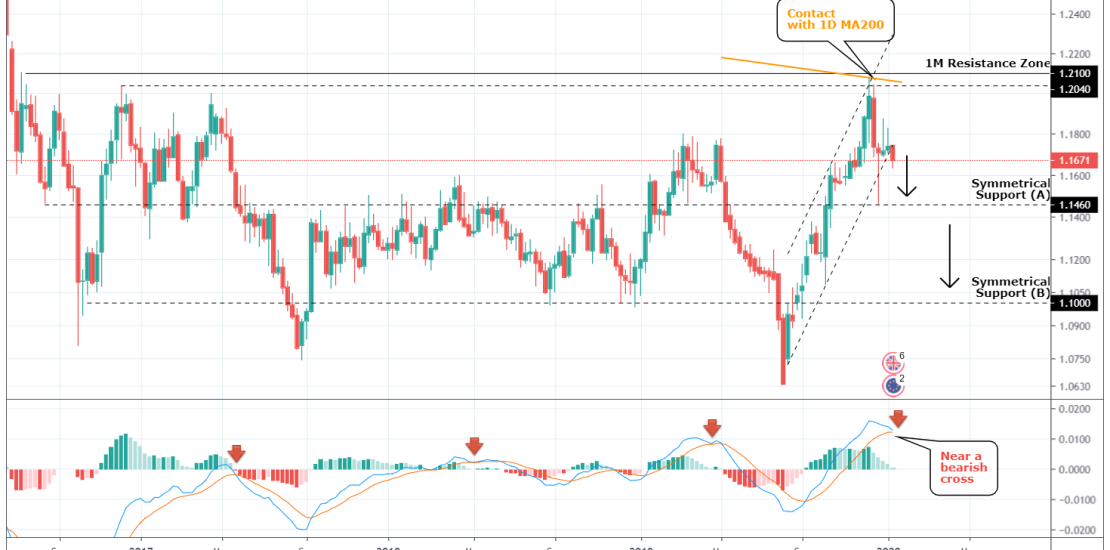
Pattern: Channel Up on 1W (dashed channel). Signal: Bearish as after the price failed to cross the 1M Resistance Zone, it got rejected on the 1D MA200 and the Channel Up broke to the downside. MACD also rolling over. Target: 1.1460 (symmetrical Support A) and 1.1000 (symmetrical Support B). Tradingview link: https://www.tradingview.com/chart/GBPEUR/Kc9sLgk2-GBPEUR-Sell-Signal
-
BITCOIN Don’t worry about the ups and downs. Just accumulate!
- January 9, 2020
- Posted by: Tradingshot Articles
- Category: Cryptocurrency
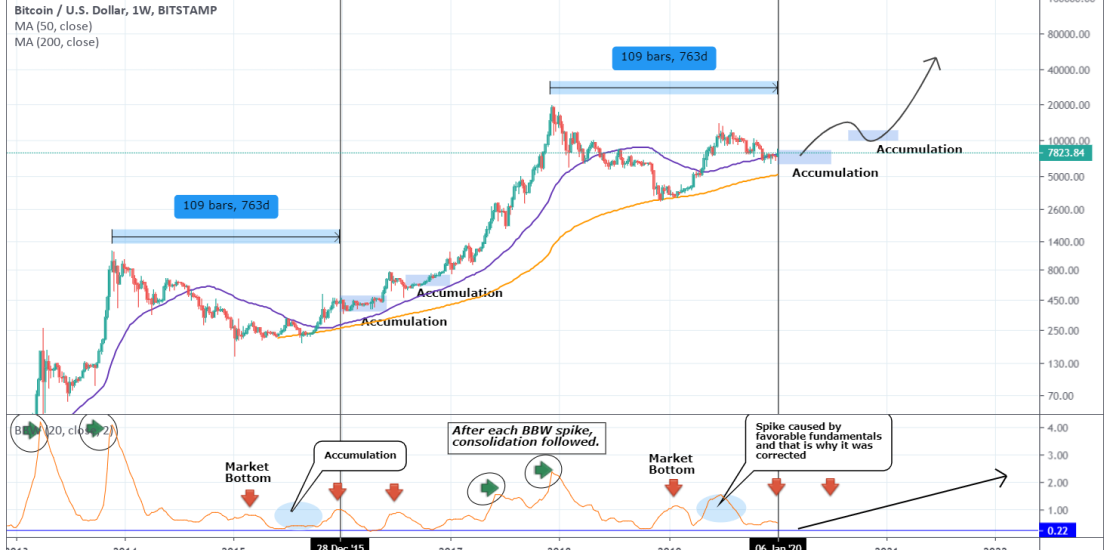
This will be a short analysis and the indicator I am using couldn’t make the picture much more clear. The Bollinger Bands Width (BBW), when Bitcoin is in a Bull Cycle, indicates periods of high volatility and accumulation. We see on the chart that at the moment the price is in on an extended
-
EURUSD Sell Signal
- January 9, 2020
- Posted by: Tradingshot Articles
- Category: Forex
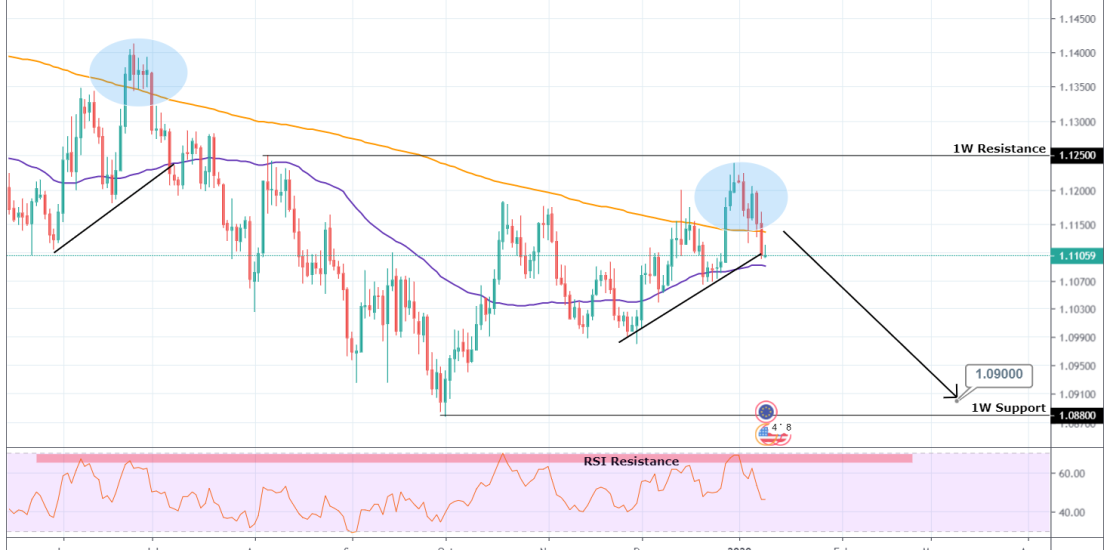
Pattern: Channel Up on 1D. Signal: Bearish as the RSI failed to break its multi month Resistance Zone and the pattern forming resembles the late June 2019 top. Target: 1.09000 (just above the 1W Support). Tradingview link: https://www.tradingview.com/chart/EURUSD/3Y3JjMuJ-EURUSD-Sell-Signal
-
XAUUSD Consolidation/ Buy Signal
- January 9, 2020
- Posted by: Tradingshot Articles
- Category: Commodities
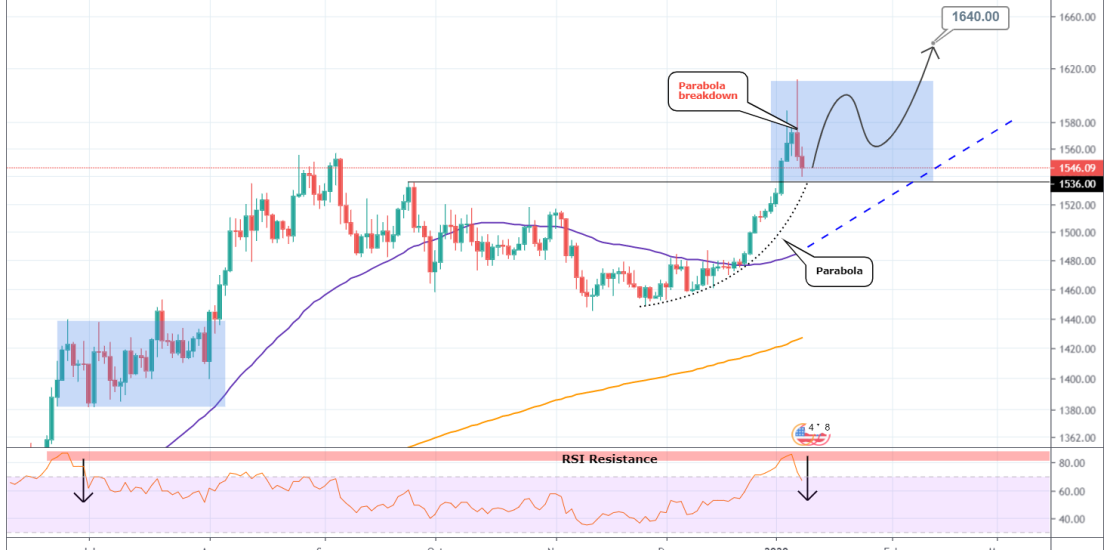
Pattern: Parabolic rise on 1D. Signal: Bullish as after the parabola broke down, the price reached the Support getting rejected on the 6-month RSI Resistance Zone. Target: 1640. Tradingview link: https://www.tradingview.com/chart/XAUUSD/MZKYkqhG-XAUUSD-Consolidation-Buy-Signal
-
AUDUSD Sell Signal
- January 8, 2020
- Posted by: Tradingshot Articles
- Category: Forex
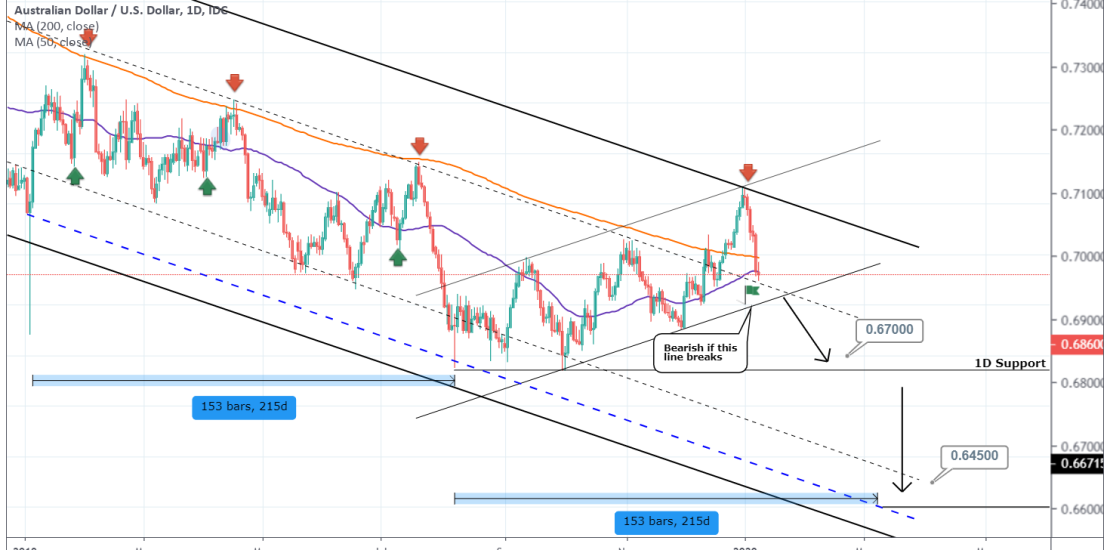
Pattern: Channel Up on 1D. Signal: Bearish if the Higher Low trend line breaks (flag mark) as the price has been already rejected on the wider 1M Channel Down (bold channel). Target: 0.6700 (just below the 1D Support). If the 1D Support breaks we may see an extension on the 1M Channel Down towards a
-
BITCOIN can test $20000. A 2020 year-end projection.
- January 4, 2020
- Posted by: Tradingshot Articles
- Category: Cryptocurrency
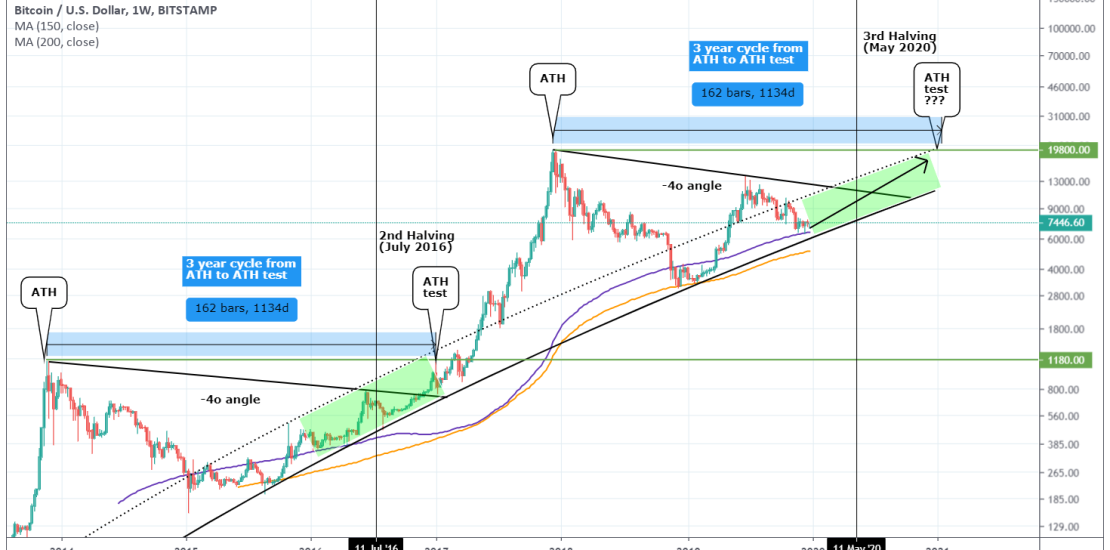
New year for Bitcoin and a whole new possibilities ahead. On this study I will share my 2020 year-end projection. There is no better place to start with than using the previous Bull Cycle, namely the start of it (2016 – 2017), as a reference point. *The time from All Time Highs (ATH) to ATH
-
XTZUSD Buy Signal
- January 3, 2020
- Posted by: Tradingshot Articles
- Category: Cryptocurrency
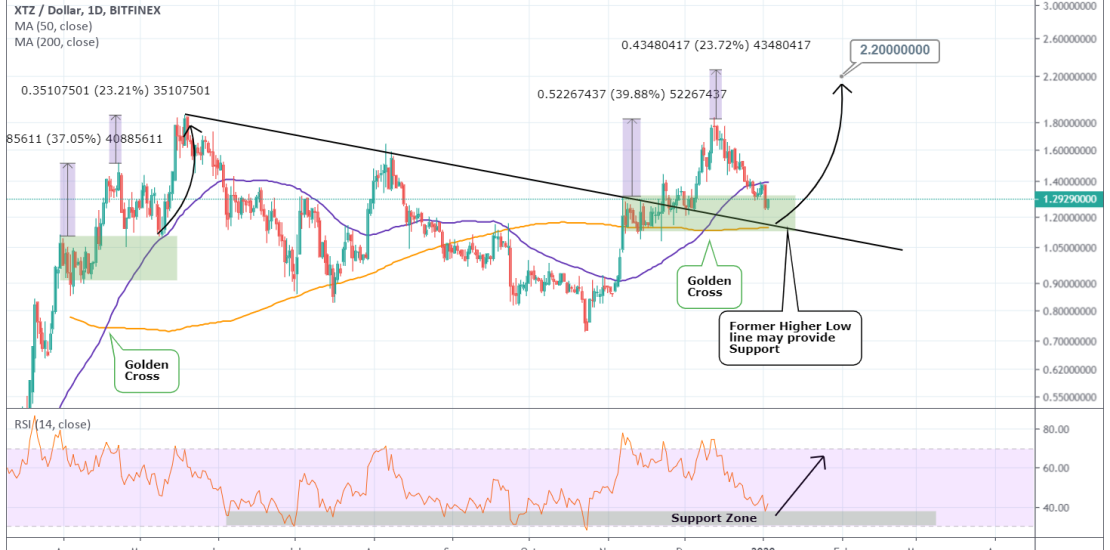
Pattern: Channel Down on 4H. Signal: Bullish as the price is approaching the former Higher Low line and the 1D MA200, both of which can provide Support. Target: 2.2000. Tradingview link: https://www.tradingview.com/chart/XTZUSD/v5N9uupS-XTZUSD-Buy-Signal
-
NZDUSD Sell Signal
- January 3, 2020
- Posted by: Tradingshot Articles
- Category: Forex
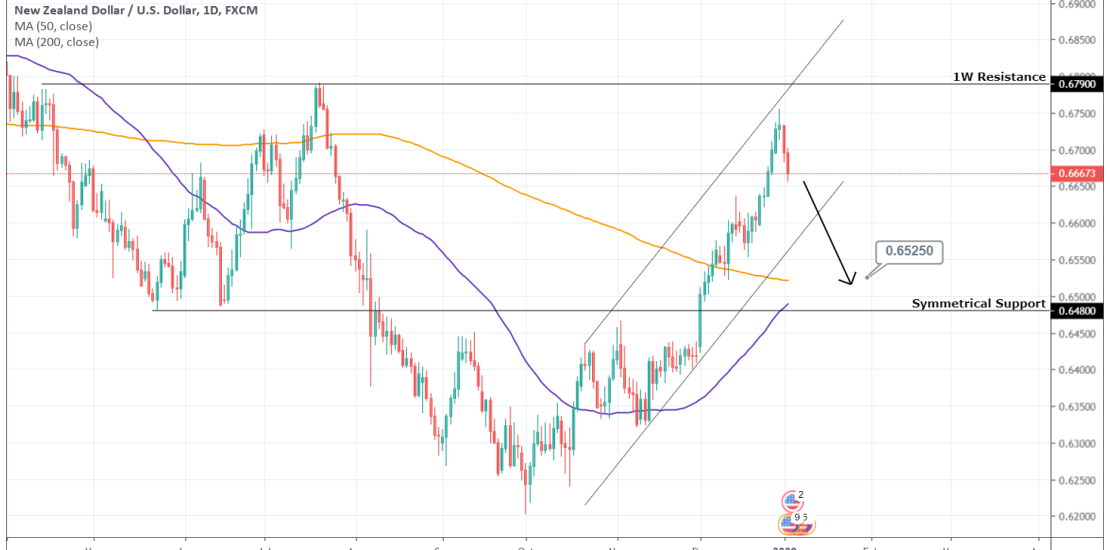
Pattern: Channel Up on 1D. Signal: Bearish as the price was rejected near the 1W Resistance. Target: 0.6525 (above the Symmetrical Support). Tradingview link: https://www.tradingview.com/chart/NZDUSD/qOaTXSSo-NZDUSD-Sell-Signal
-
BITCOIN Cycle mean & preHalving BOTTOM. Best time to accumulate!
- December 24, 2019
- Posted by: Tradingshot Articles
- Category: Cryptocurrency
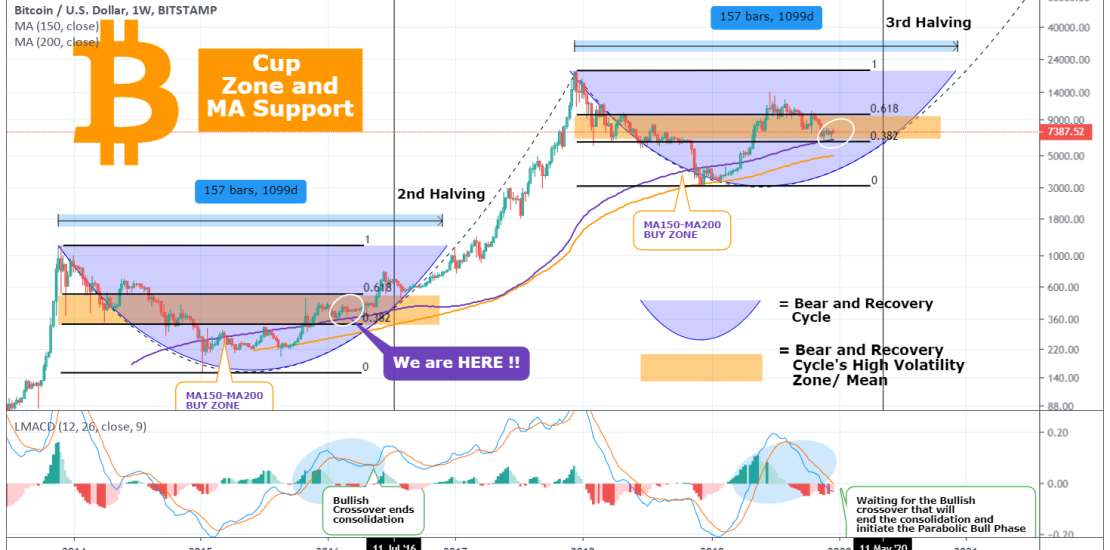
Before starting my analysis I want to wish everyone Merry Christmas! Now, I have made this chart in an attempt to put all correlating factors of Bitcoin’s previous and current cycle into perspective. The parameters that I am focusing on are the MA150/200, the Cycles’ High Volatility Zone, the 2nd and 3rd Halvings and the
-
BITCOIN Too many long term bullish indicators to ignore.
- December 22, 2019
- Posted by: Tradingshot Articles
- Category: Cryptocurrency
Just a quick reminder on the position Bitcoin is at on its long term cycle. As the title says there are just too many bullish indicators at this stage to ignore if you are a long term BTC investors. That doesn’t mean that the price “can’t” drop lower e.g. 5 – 5.5k but after the