

2023
-
BITCOIN The potential Resistance in 2023 based on the DXY.
- February 3, 2023
- Posted by: Tradingshot Articles
- Category: Cryptocurrency
No Comments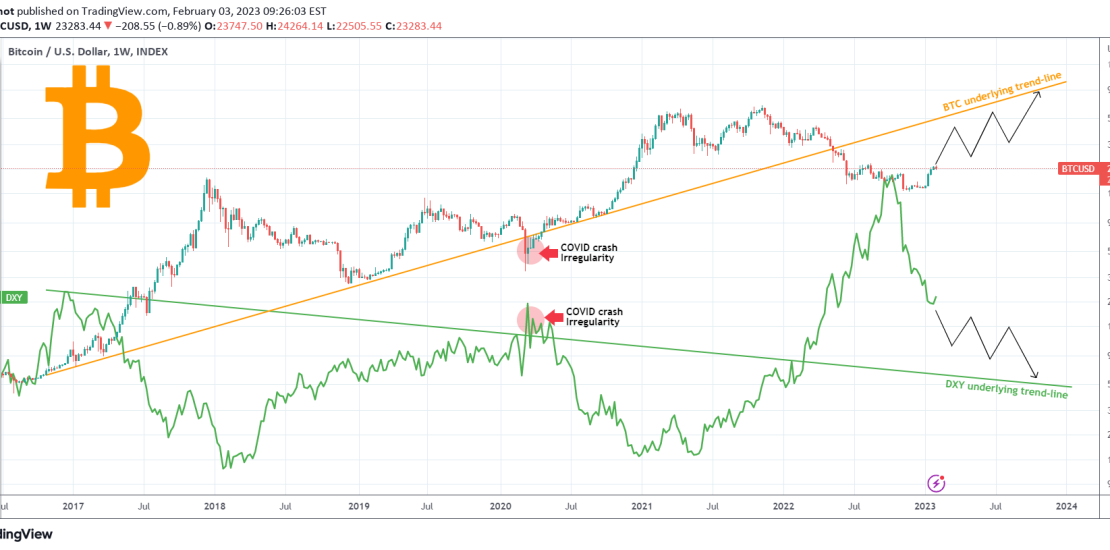
In continuation of our recent BTC-DXY cross comparison studies, we will quickly bring you today a trend-line that may have gone overlooked and can pose a real Resistance to Bitcoin (BTCUSD) in 2023. As you see, if we exclude the March 2020 COVID crash period which is a non-technical irregularity, there is an underlying trendline
-
META You were warned. This is a V-shaped recovery.
- February 2, 2023
- Posted by: Tradingshot Articles
- Category: Stocks
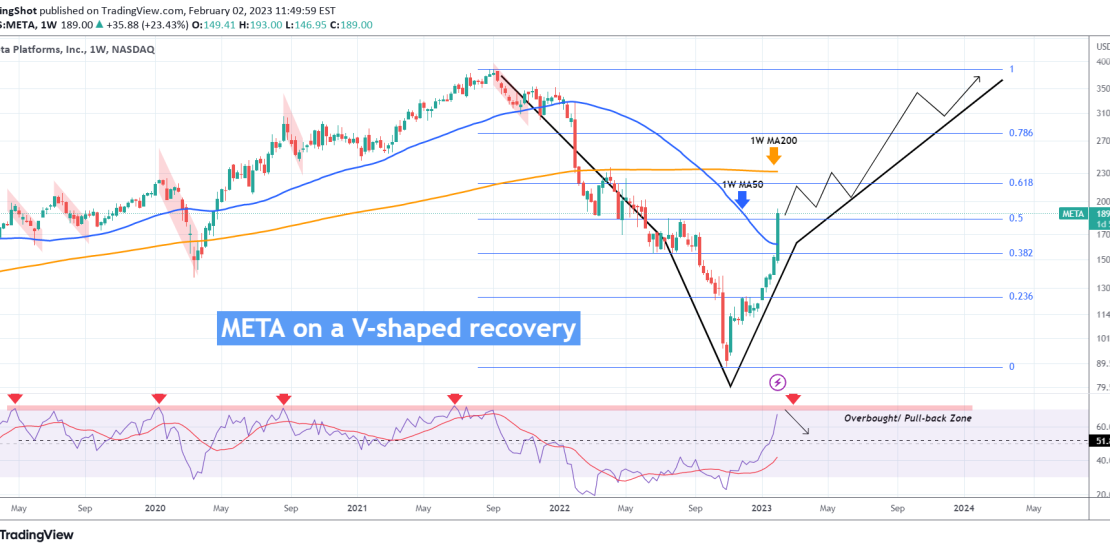
Meta Platforms (META) stock is surging through the roof following the encouraging Fed outlook on future rate hikes and Zuckerberg’s promises on stock buy-backs, cost cutting and focus on profitability. We warned META was an excellent buy last month after closing two straight green monthly candles as well as back in November when we advised
-
MVUSD Broke above the 1D MA200 but one last Resistance remains.
- February 1, 2023
- Posted by: Tradingshot Articles
- Category: Uncategorized
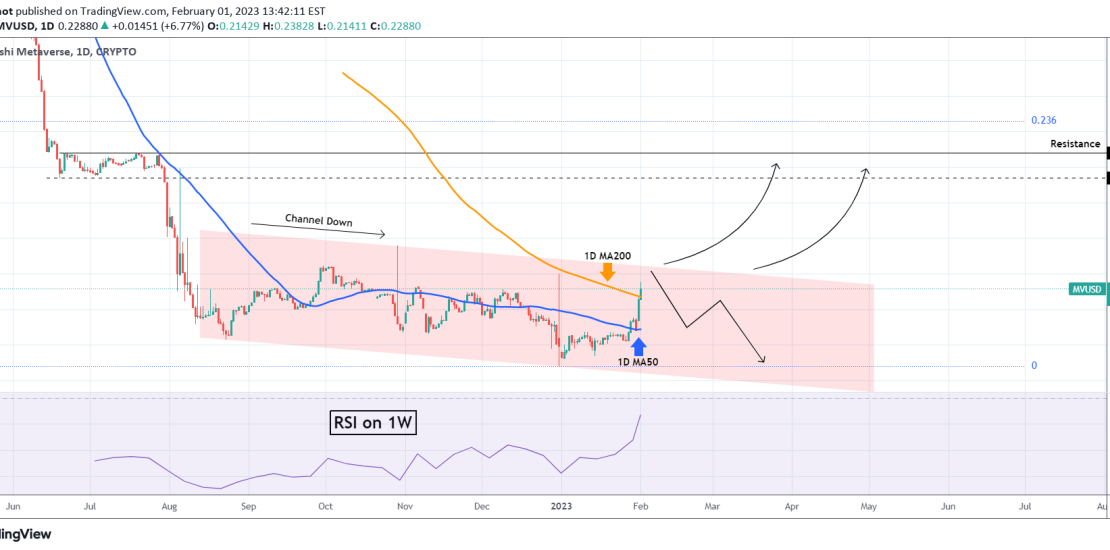
The GensoKishi Metaverse (MVUSD) broke today above its 1D MA200 (orange trend-line) for the first time in history after making a rebound on the 1D MA50 (blue trend-line). We are not getting excited yet as the price remains within the Channel Down pattern that started after the August 23 2022 Low. A break above the
-
BITCOIN The Super Cycle Theory based on the USD
- February 1, 2023
- Posted by: Tradingshot Articles
- Category: Cryptocurrency
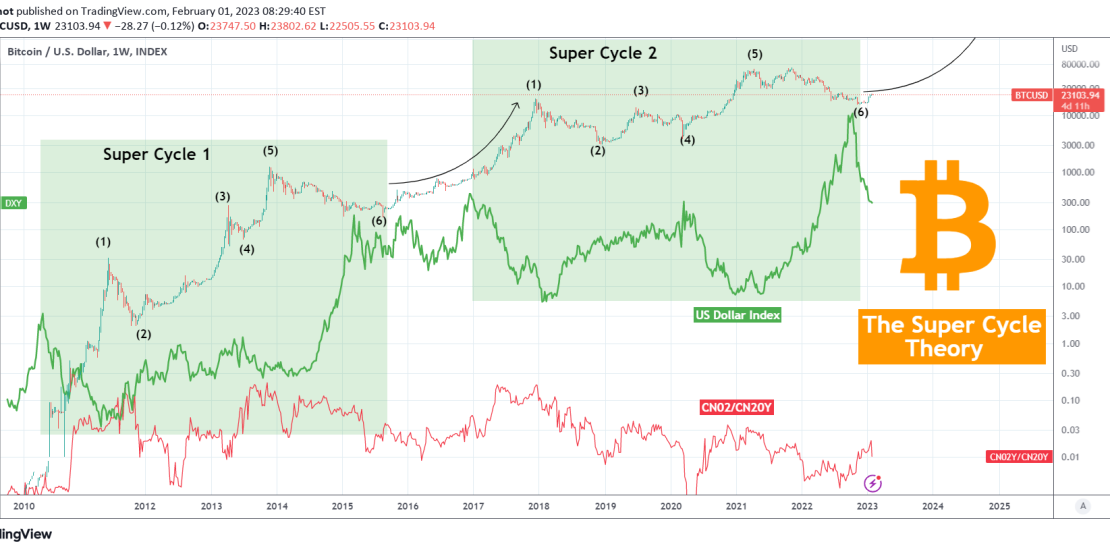
This is not the first time we look into the Super Cycle Theory, which is the idea that Bitcoin (BTCUSD) may have just finished its 2nd Cycle instead of the traditional notion of the Four Cycles driven by the Halvings. It is however the first time we look into it using the U.S. Dollar Index
-
XAGUSD Hanging on a tight thread about to turn bearish.
- January 31, 2023
- Posted by: Tradingshot Articles
- Category: Commodities
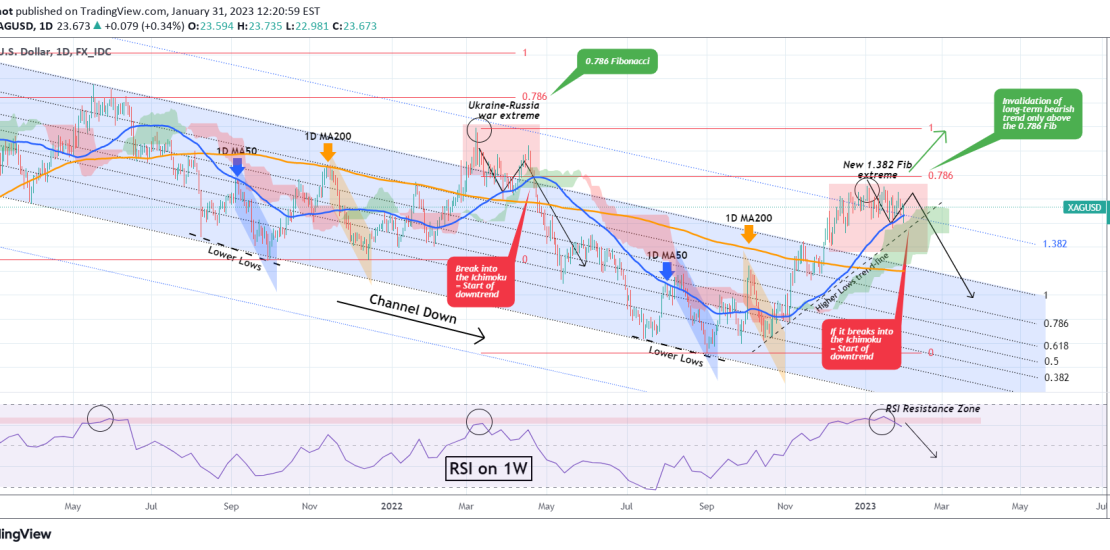
Silver (XAGUSD) couldn’t have gone better since our September 12 buy signal as following the Lower Lows Double Bottom, it not only broke above the 1D MA50 (blue trend-line) and 1D MA200 ( orange trend-line), but also made a new Extreme High on the 1.382 Fibonacci extension . As you see, we’ve charted Silver’s pattern
-
NASDAQ holding the 1 month pattern
- January 30, 2023
- Posted by: Tradingshot Articles
- Category: Stock Indices
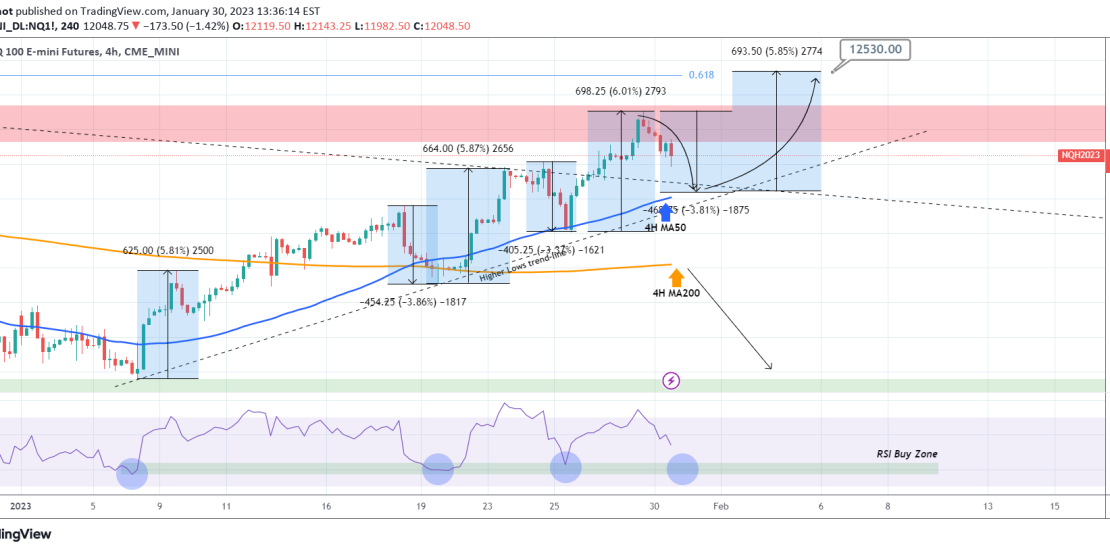
Nasdaq (NDX) is pull-back following Friday’s high. This is nothing more than a technical 1-month pattern which, supported by the 4H MA50 (blue trend-line) is posting rises around +6% and pull-backs around -3.5%. The 4H MA50 is currently a little over 11800 and a -3.80% pull-back (max on the pattern) can make exact contact with
-
BITCOIN The month is closing on an enormous buy signal
- January 30, 2023
- Posted by: Tradingshot Articles
- Category: Cryptocurrency
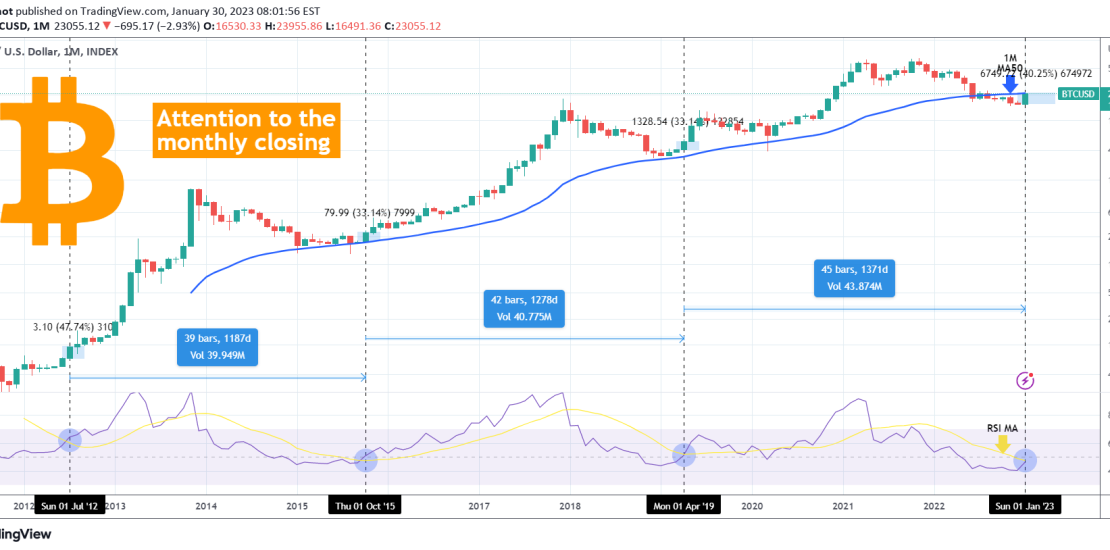
We only look at Bitcoin (BTCUSD) on the monthly time-frame when it is necessary to keep a long-term perspective and not miss the big picture. This is one of those times as the monthly (1M) candle, following January’s hyper strong rise and impressive start to the year, is now testing the 1M MA50 (blue trend-line).
-
NZDCAD High probability short when the 1D MA100 breaks
- January 27, 2023
- Posted by: Tradingshot Articles
- Category: Forex
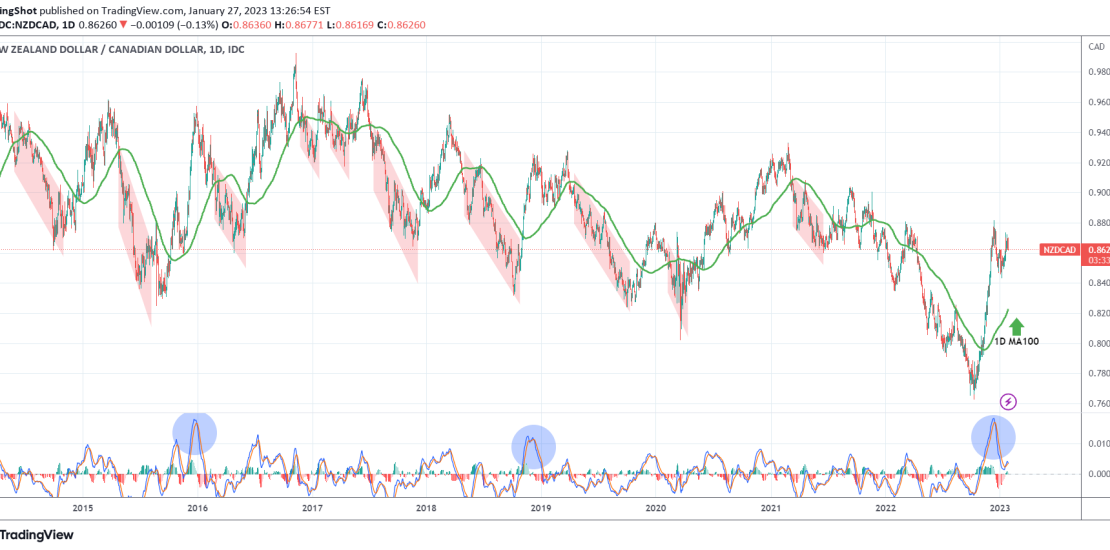
NZDCAD has turned sideways within a Triangle pattern in the past 30 days, showing the first signs of exhaustion on the incredible rally since October 11 2022. We don’t recommend buying this pair anymore but instead we can short with high probabilities of success when the 1D MA100 (green trend-line) breaks. As you see on
-
BITCOIN It’s blue-print is Gold and it is a bullish one.
- January 27, 2023
- Posted by: Tradingshot Articles
- Category: Cryptocurrency
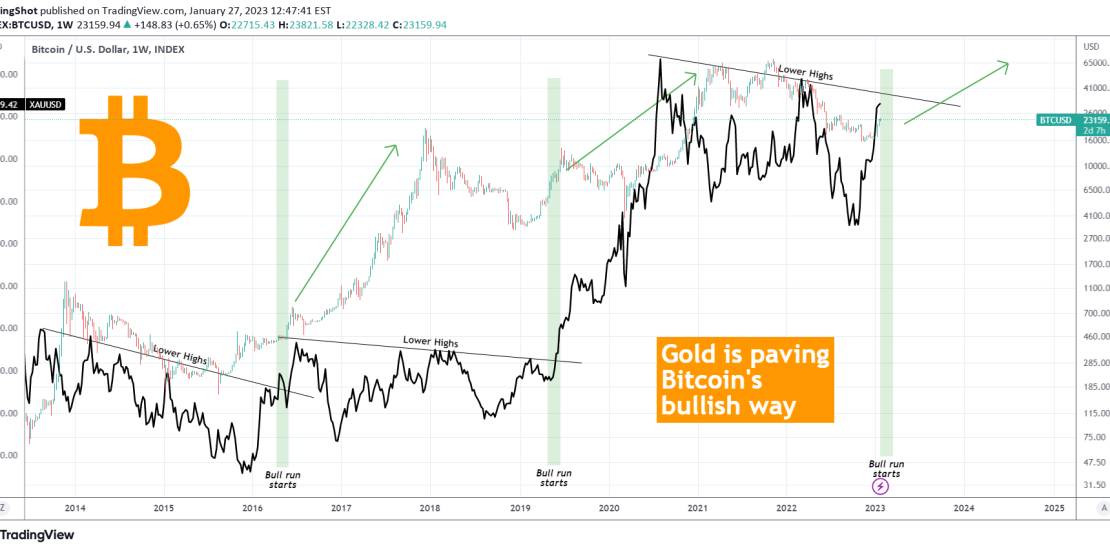
Bitcoin (BTCUSD) is displayed on this 1W chart alongside Gold (XAUUSD) by the black trend-line. The text will be short as the chart is pretty much self-explanatory. Every time Gold breaks its Lower Highs trend-line, BTC is past its bottom and well into its Bull Cycle, starting an aggressive rally. Right now Gold is dangerously
-
TESLA Above its 1D MA50, first time since September. 193 target.
- January 26, 2023
- Posted by: Tradingshot Articles
- Category: Stocks
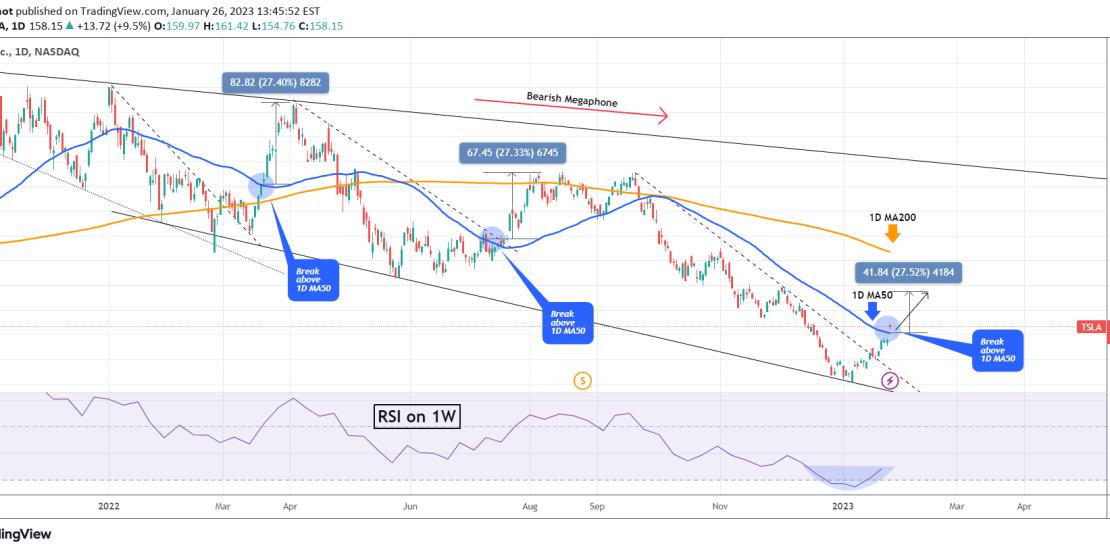
Tesla Inc (TSLA) broke today above its 1D MA50 (blue trend-line) for the first time since September 22 2022. This is a major bullish break-out on the medium-term as every time it did so inside the long-term Bearish Megaphone pattern, the price rose by around +27.50%. The 1W RSI is on a bullish reversal bottom