- February 1, 2023
- Posted by: Tradingshot Articles
- Category: Cryptocurrency

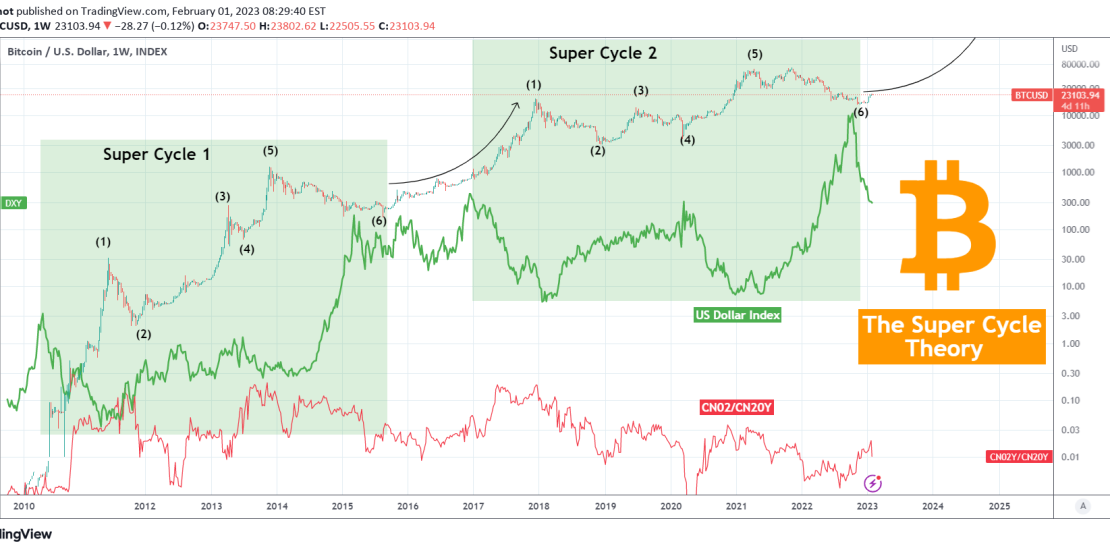
This is not the first time we look into the Super Cycle Theory, which is the idea that Bitcoin (BTCUSD) may have just finished its 2nd Cycle instead of the traditional notion of the Four Cycles driven by the Halvings.
It is however the first time we look into it using the U.S. Dollar Index (DXY) and our favorite CN02/CN20Y ration (Chinese Bond Yields 02Y/20Y). As you see on this 1W chart, this correlation is indeed eye-opening as it paints very efficiently the picture of the two Super Cycles.
The DXY (strong) pull-back shows that we are past leg (6), which is the bottom of the Super Cycle and have entered the rally phase. The Higher High on the CN02/CN20Y shows that we could be much closer to the start of the parabolic part than we think. If the DXY extends its aggressive decline, it will confirm the latter notion but a rebound and multi-month consolidation (on the DXY) will take us more smoothly into the rally phase.
Do you agree with this Super Cycle Theory based on the USD? Feel free to let us know in the comments section below!
Tradingview link:
https://www.tradingview.com/chart/BTCUSD/U9d0CgrS-BITCOIN-The-Super-Cycle-Theory-based-on-the-USD

