

2021
-
MANAUSDT Bear Flag on 1D. Attention needed.
- November 29, 2021
- Posted by: Tradingshot Articles
- Category: Cryptocurrency
No Comments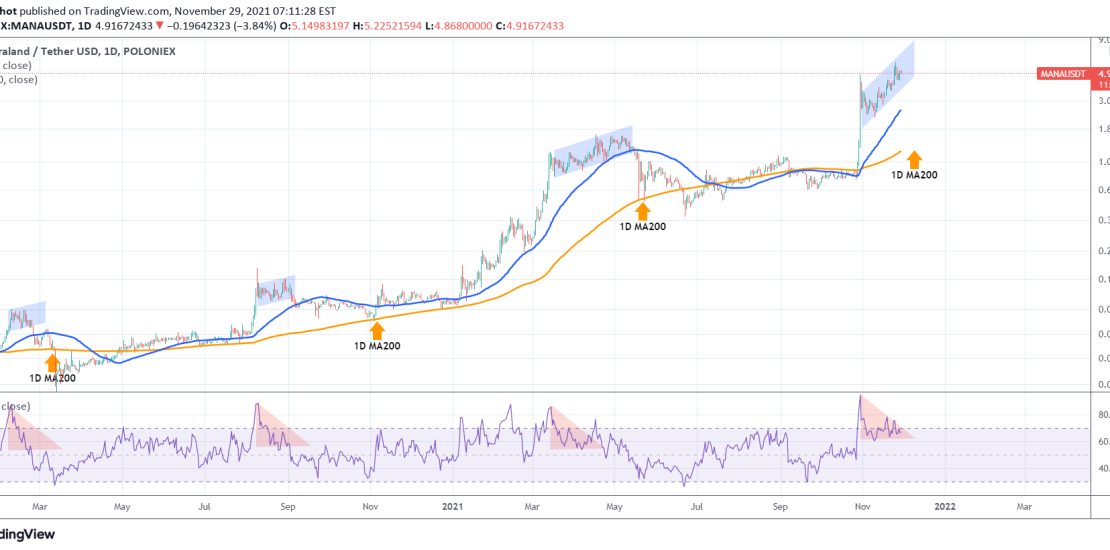
MANA has seen extreme gains on a 1 month horizon. However buyers should be careful at this stage as on the 1D time-frame, the price is printing a Bear Flag, the likes of which has been a strong red signal in the past. As you see on the chart, every time this pattern along
-
WTI OIL Rejection on the 1D MA50
- November 25, 2021
- Posted by: Tradingshot Articles
- Category: Commodities
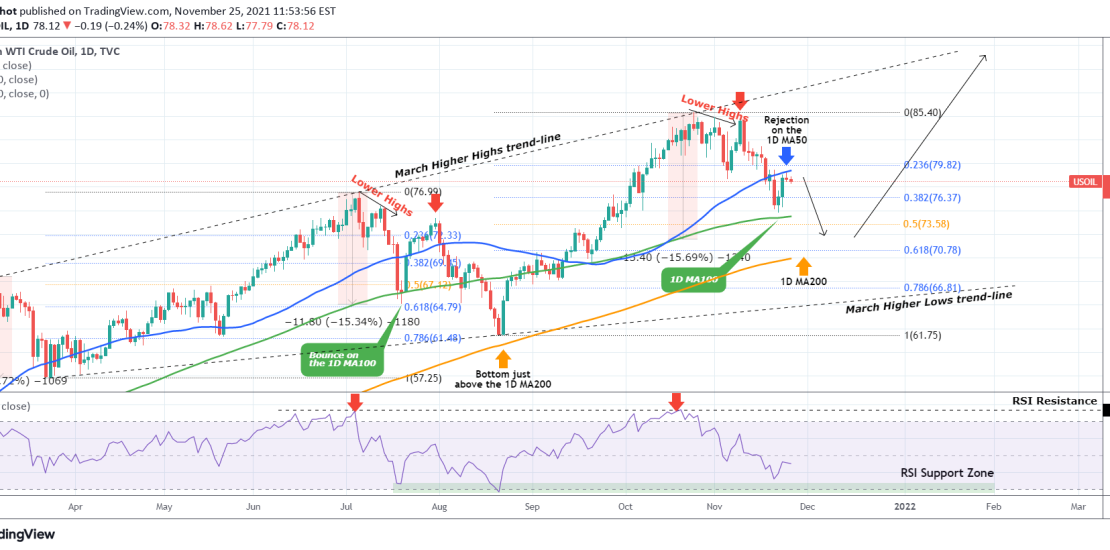
Pattern: Megaphone on the 1D time-frame. Signal: Sell as the price has been rejected on the 1D MA50 (blue trend-line) and buy before it touches the 1D MA200 (orange trend-line) or when the RSI hits the Support Zone. Target: 85.40 (the October 23 High). Tradingview link: https://www.tradingview.com/chart/USOIL/Ruv1Y4G2-WTI-OIL-Rejection-on-the-1D-MA50
-
COPPER Buy signal
- November 24, 2021
- Posted by: Tradingshot Articles
- Category: Commodities
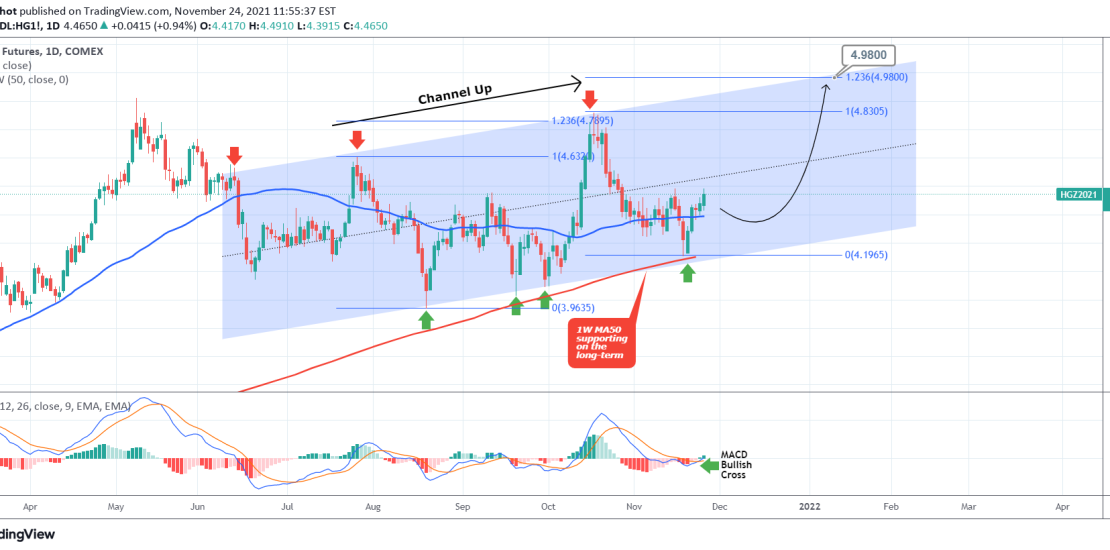
Pattern: Channel Up on 1D. Signal: Buy as the price is rebounding on the Higher Lows (bottom) trend-line of the Channel Up while the MACD just formed a Bullish Cross. Target: 4.980 (the 1.236 Fibonacci extension). Tradingview link: https://www.tradingview.com/chart/HG1!/9bWfnHKZ-COPPER-Buy-signal
-
PLATINUM targeting $1090
- November 24, 2021
- Posted by: Tradingshot Articles
- Category: Commodities
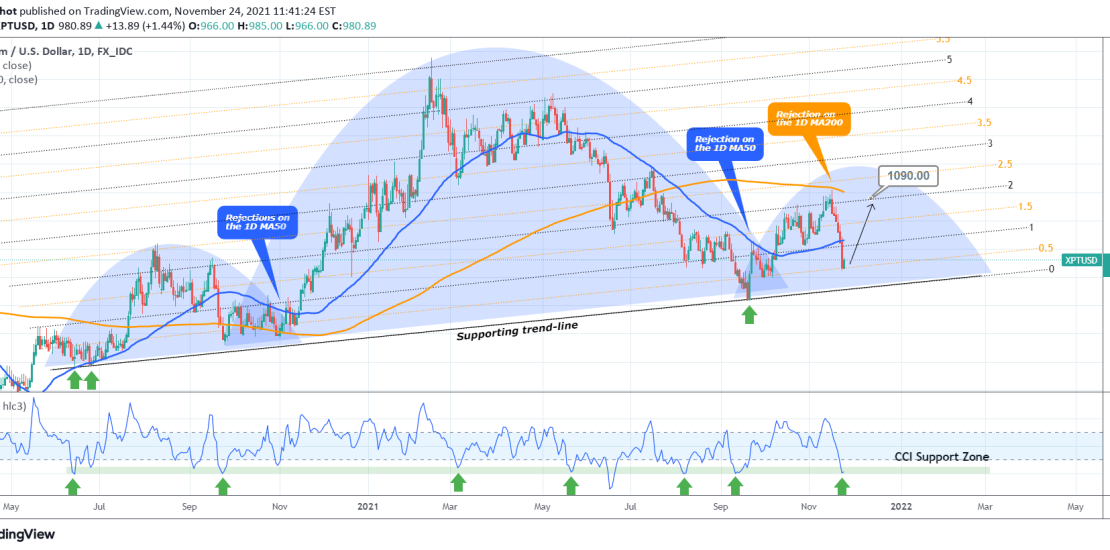
Pattern: Giant Head and Shoulders on 1D. Signal: Buy as the price hit the 0.5 Fibonacci trend-line and is near the Support. The 1D CCI is also on its Core long-term Support. Target: 1090 (potential contact with the 1D MA200 (orange trend-line) and right on the 2.0 Fibonacci extension). Tradingview link: https://www.tradingview.com/chart/XPTUSD/fDBsJTAs-PLATINUM-targeting-1090
-
XAUUSD Correction towards the 1D MA50
- November 22, 2021
- Posted by: Tradingshot Articles
- Category: Commodities
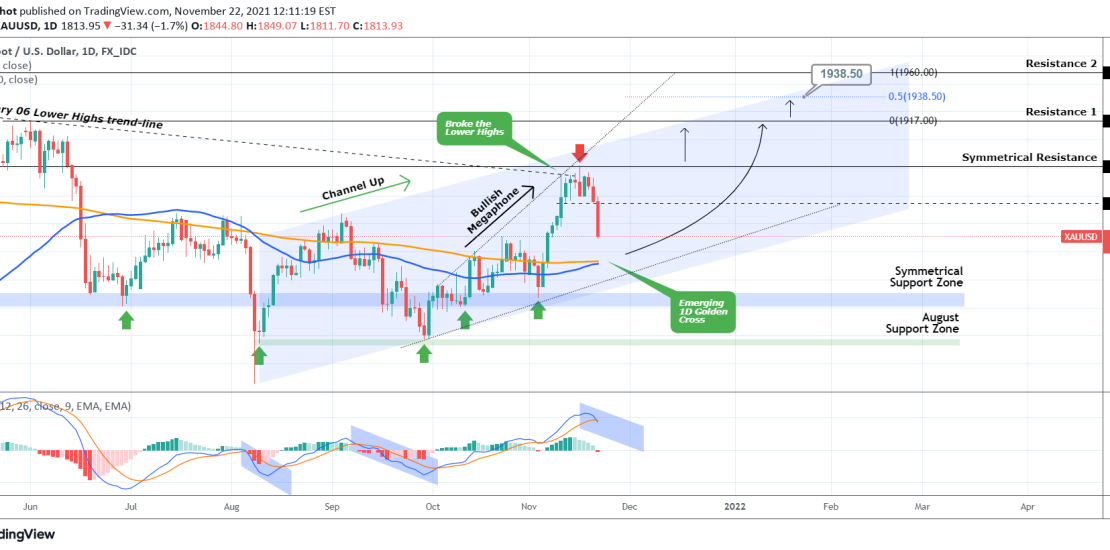
This is an update to the 30 day trading plan I published last week: Obviously as the condition of closing a 1D candle above the 1876 Symmetrical Resistance was not fulfilled, the bullish momentum failed and Gold got heavily rejected today. As mentioned on the trading plan, the natural Support is the 1D MA50
-
WTI OIL can go much lower based on this pattern
- November 19, 2021
- Posted by: Tradingshot Articles
- Category: Commodities
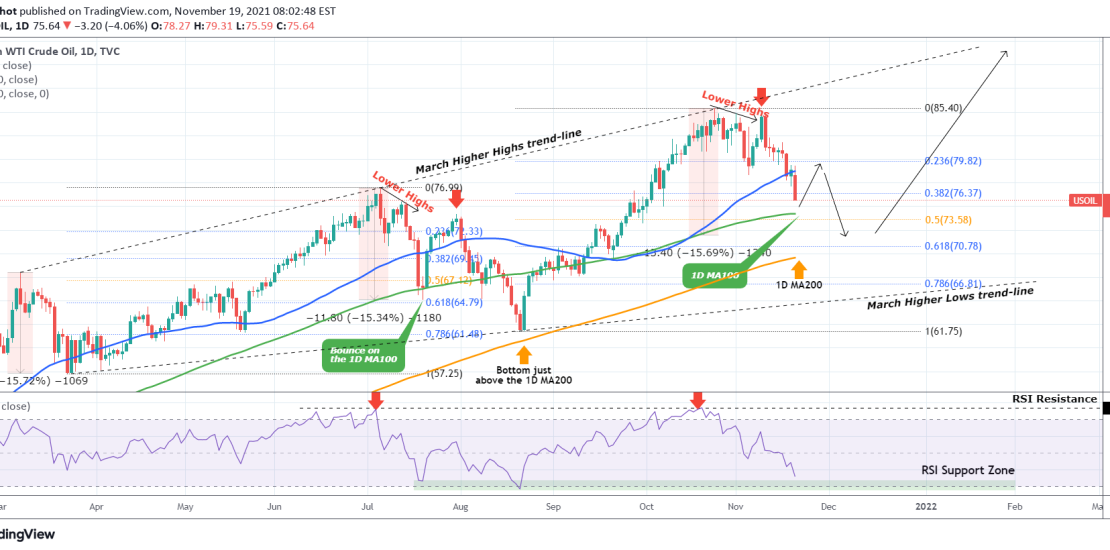
It was exactly one month ago (October 19) when I reversed my bullish thesis on WTI Crude Oil, calling for a top and a reversal: As you see, the top got priced exactly on the March Higher Highs trend-line and the rejection successfully took place. Even early into November, the Lower Highs peak formation
-
XAUUSD broke major Resistances. Check this 30 day trading plan.
- November 18, 2021
- Posted by: Tradingshot Articles
- Category: Commodities
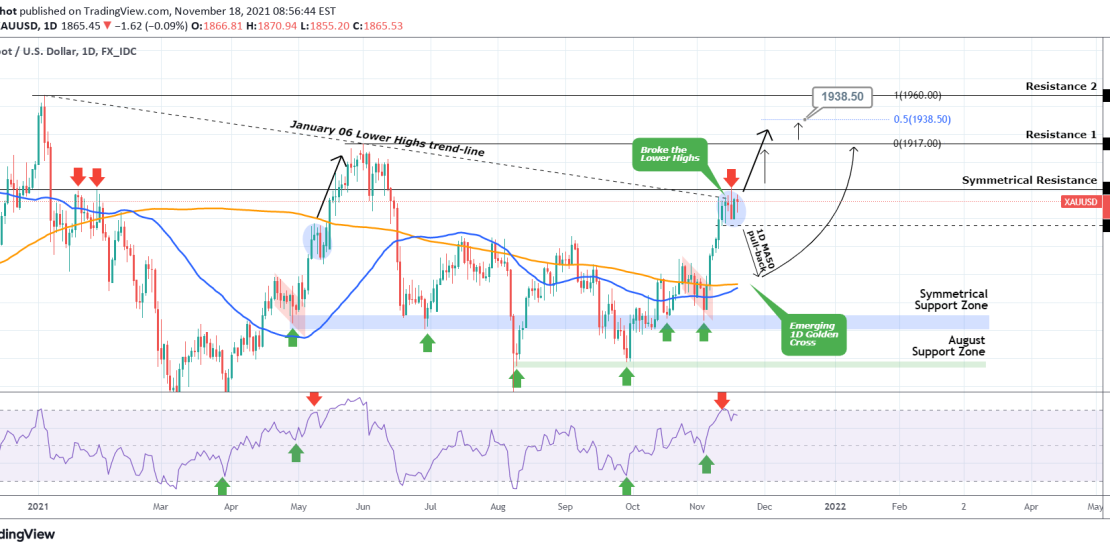
It’s been a while since I updated my Gold thesis. My last post was a short-term bullish trade on 4H: That target has been achieved and now we have to switch back to 1D for a more effective evaluation of the current trend. Obviously that is bullish as not only has Gold (XAUUSD) been
-
WTI OIL Break-out or rejection
- November 9, 2021
- Posted by: Tradingshot Articles
- Category: Commodities
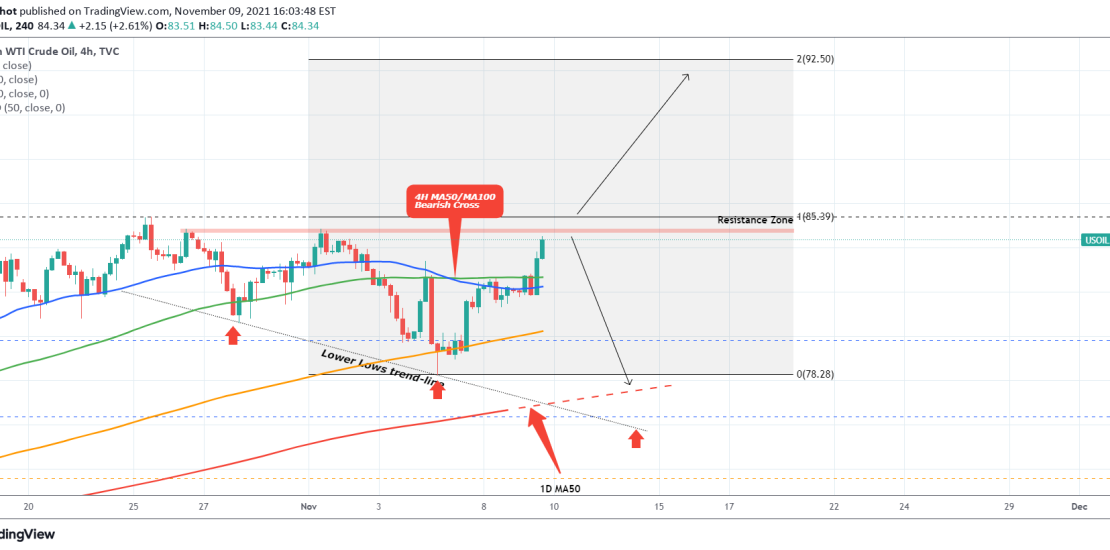
Oil is approaching the most important trend-line on the medium-term, the 84.80 – 85.40 Resistance Zone. A break and session close above 85.40 should technically aim at the 2.0 Fibonacci extension of 92.50. On the other hand, a rejection at 84.80 should aim at the 1D MA50 (red trend-line) and the Lower Lows trend-line.
-
S&P500 The 1D RSI is overbought on a big red signal
- November 5, 2021
- Posted by: Tradingshot Articles
- Category: Stock Indices
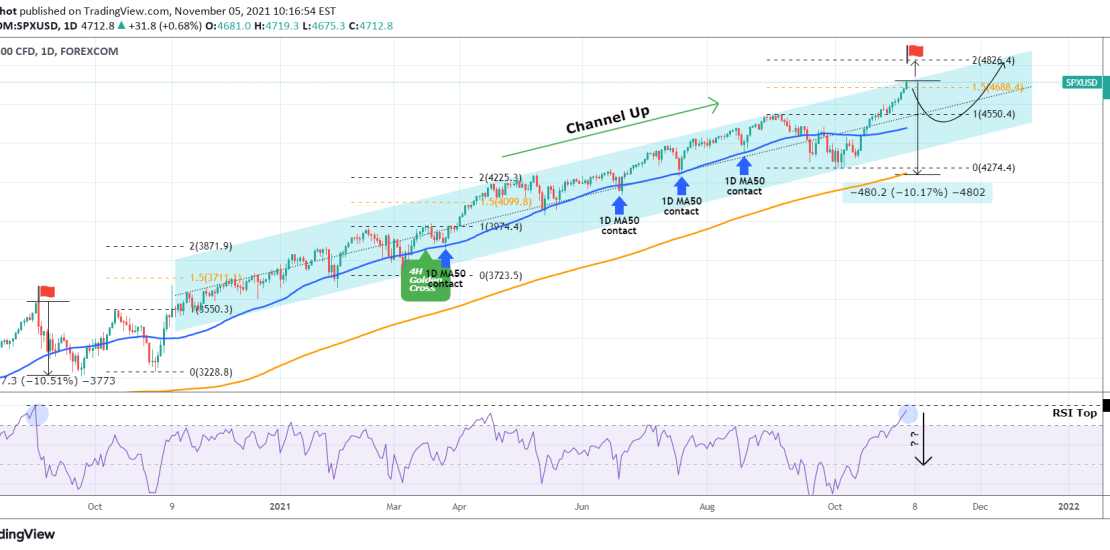
S&P has been trading within a Channel Up ever since the November 2020 U.S. elections. During that time, the RSI on the 1D time-frame has never gone above 76.30. Right now however, it is overbought and approaching the 80.000 Resistance where it was last seen on September 03 2020. As you see on the
-
XAUUSD Trading Plan
- November 4, 2021
- Posted by: Tradingshot Articles
- Category: Commodities
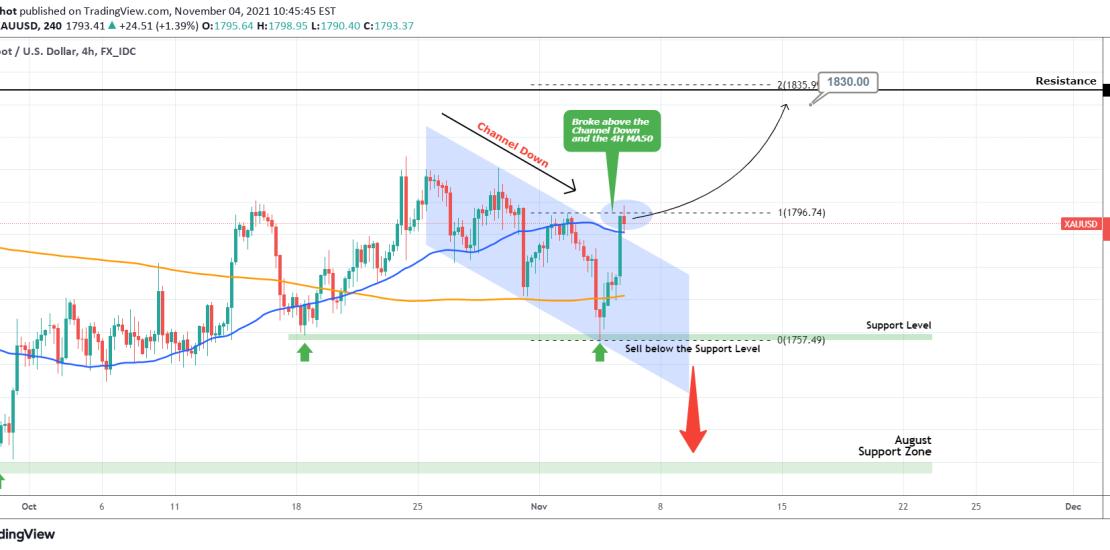
Gold broke above the Channel Down and the 4H MA50 (blue trend-line) in the aftermath of the Fed Press Conference yesterday. This is a short-term buy signal towards the 1834.50 Resistance. On the other hand, if the price breaks below the 1,757.50 Support level, it’s a strong sell signal towards the 1,720 August Support