

- November 19, 2021
- Posted by: Tradingshot Articles
- Category: Commodities
It was exactly one month ago (October 19) when I reversed my bullish thesis on WTI Crude Oil, calling for a top and a reversal:

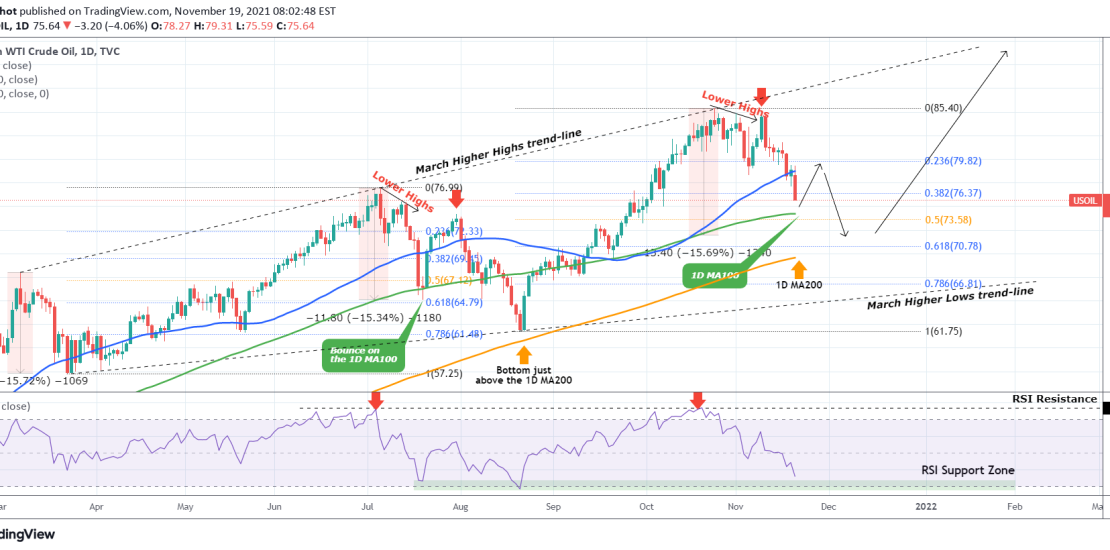
As you see, the top got priced exactly on the March Higher Highs trend-line and the rejection successfully took place. Even early into November, the Lower Highs peak formation was clear:


Back to today. In my firm’s outlook, since the 1D MA50 (blue trend-line) broke, the only level that may support Oil is the 1D MA100 (green trend-line) and that only temporarily. Why? Because this is what happened last time on July 20, a short-term hold there followed by a dead-cat bounce above the 1D MA50 again only to serve as a new rejection towards the 1D MA200 (orange trend-line) where the price eventually made the bottom.
As you see, the major pattern since March is a Bullish Megaphone which besides the Higher Highs, has also a Higher Lows trend-line that Supports. A new contact with that trend-line would be on the 0.786 Fibonacci retracement level, which was where the bottom was formed last time on the Higher Lows trend-line in August 20. Corrections of -15% are common within this Megaphone pattern and another such correction would make a low right above the 1D MA200, which I believe will be the bottom and will prevail over a deeper contact on the Higher Lows trend-line.
Tradingview link:
https://www.tradingview.com/chart/USOIL/LHAt32WL-WTI-OIL-can-go-much-lower-based-on-this-pattern