

2021 April
-
NWCUSDT You were warned about $1.00. Still not too late to buy!
- April 20, 2021
- Posted by: Tradingshot Articles
- Category: Cryptocurrency
No Comments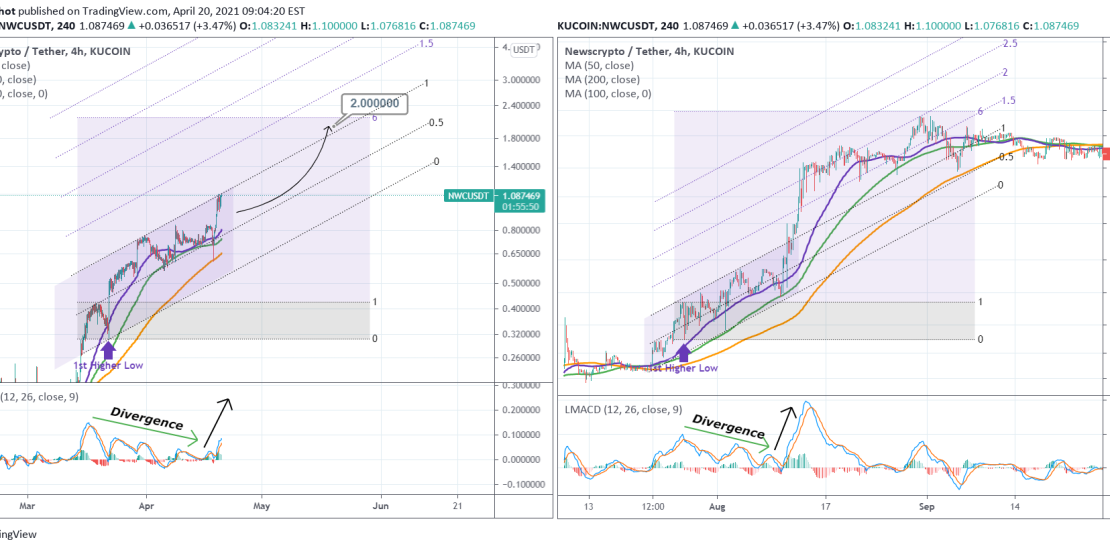
The NewsCrypto coin is doing it again. On April 03 I’ve mentioned $1.00 as the short-term target and yesterday’s candle delivered it, which shifts my attention to the next target $2.00, as per my most recent NWC analysis: At the moment I even see a more aggressive pattern which may exceed this target level, but
-
NATURAL GAS 1st Higher High since mid February. Buy.
- April 19, 2021
- Posted by: Tradingshot Articles
- Category: Commodities
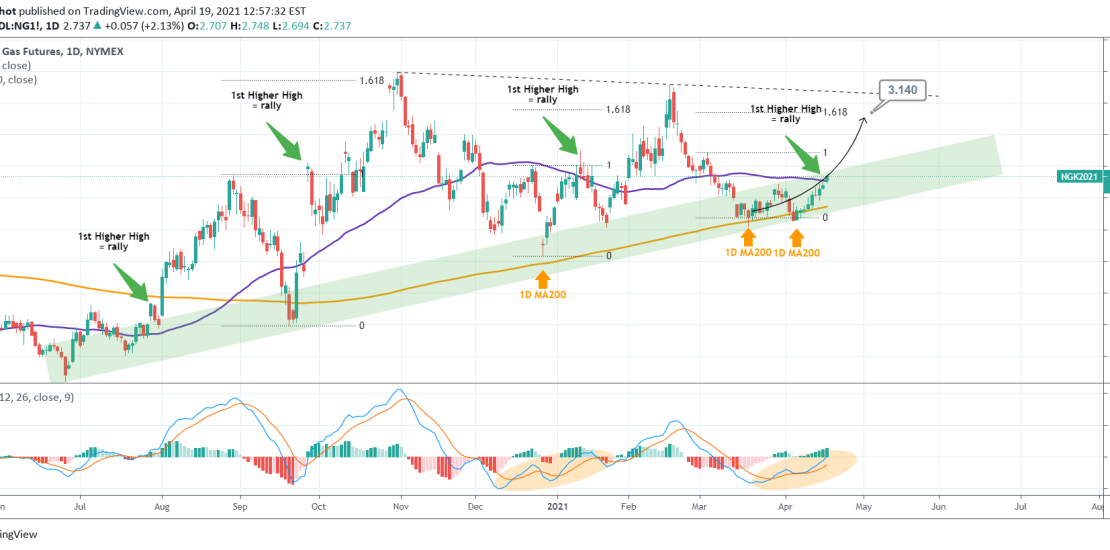
Pattern: Triangle on 1D. Signal: Buy as the price has rebounded on the 1D MA200 (orange trend-line) and formed the 1st Higher High since February 17. After a Higher High, a rally was always followed since July 2020. Target: 3.140 (the 1.618 Fibonacci extension ). Most recent signal on NG: ** Please support this
-
COPPER Buy Signal
- April 19, 2021
- Posted by: Tradingshot Articles
- Category: Commodities
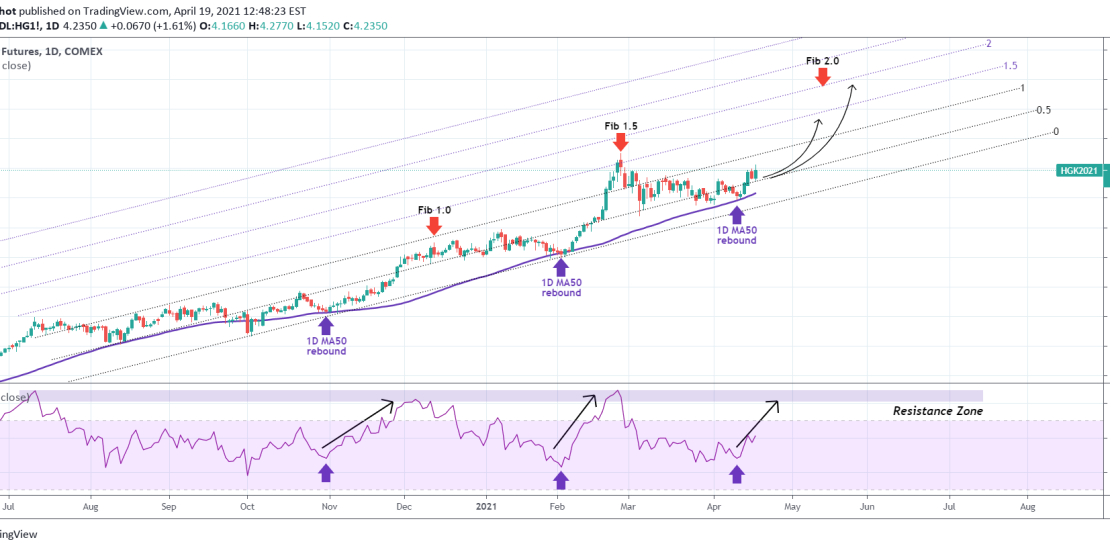
Pattern: Fibonacci Channel on 1D. Signal: Buy as the price rebounded on the 1D MA50. Target: The 1.5 Fibonacci extension level (low-risk) or the 2.0 Fibonacci level (high-risk). Previous COPPER signal: ** Please support this idea with your likes and comments, it is the best way to keep it relevant and support me. **
-
BITCOIN Natural Bull Cycle pull-back. The 1D MA100 is the key.
- April 19, 2021
- Posted by: Tradingshot Articles
- Category: Cryptocurrency
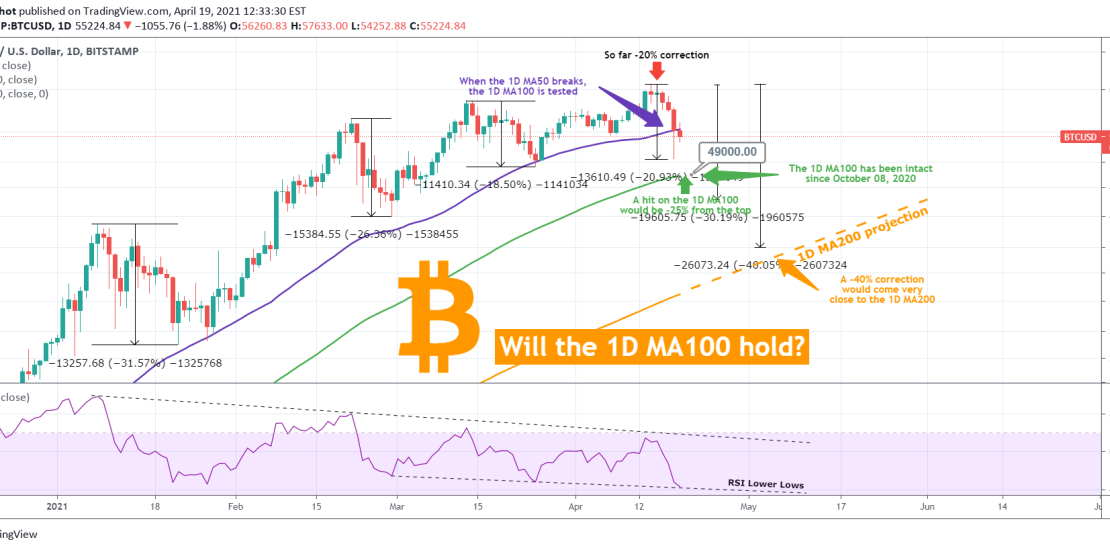
This weekend saw Bitcoin make a -20% correction from the $65000 High (All Time High/ ATH) and again as every once in a while, the panic button has been hit by many traders. The fundamentals/ news are known to you, I will only approach this technically as I have been doing during times that
-
GBPUSD Long-term buy signa
- April 16, 2021
- Posted by: Tradingshot Articles
- Category: Forex
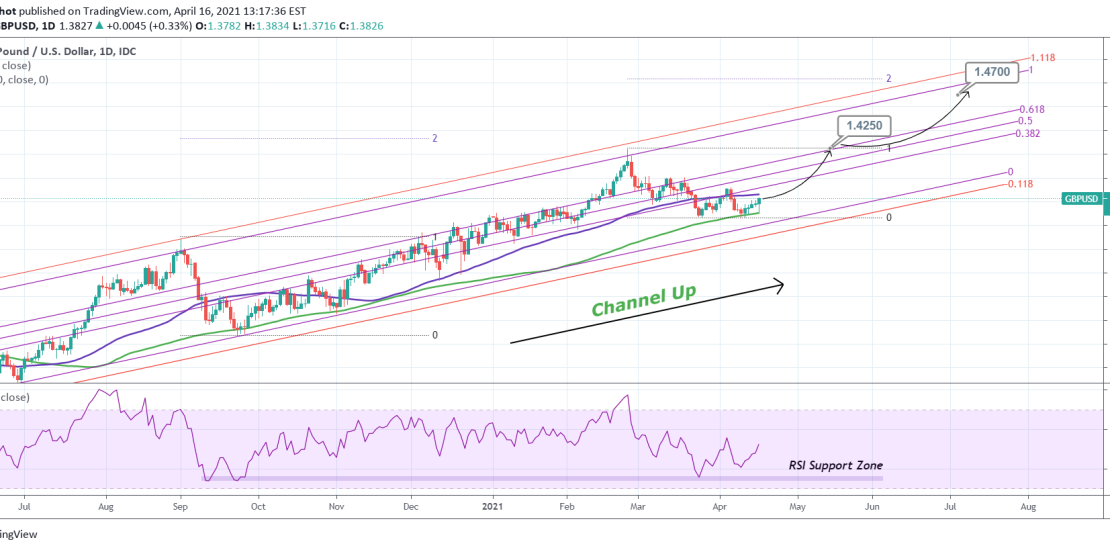
Pattern: Channel Up on 1D. Signal: Buy as the price found support within the base zone created by the 1D MA50 (blue trend-line) and the 1D MA100 (green trend-line). Appears to be repeating the September-October 2020 Bottom sequence. RSI similar. Target: 1.4250 short-term (current 1D Resistance) and 1.4700 long-term (just below the 2.0 Fibonacci
-
USDCAD Sell Signal
- April 15, 2021
- Posted by: Tradingshot Articles
- Category: Forex
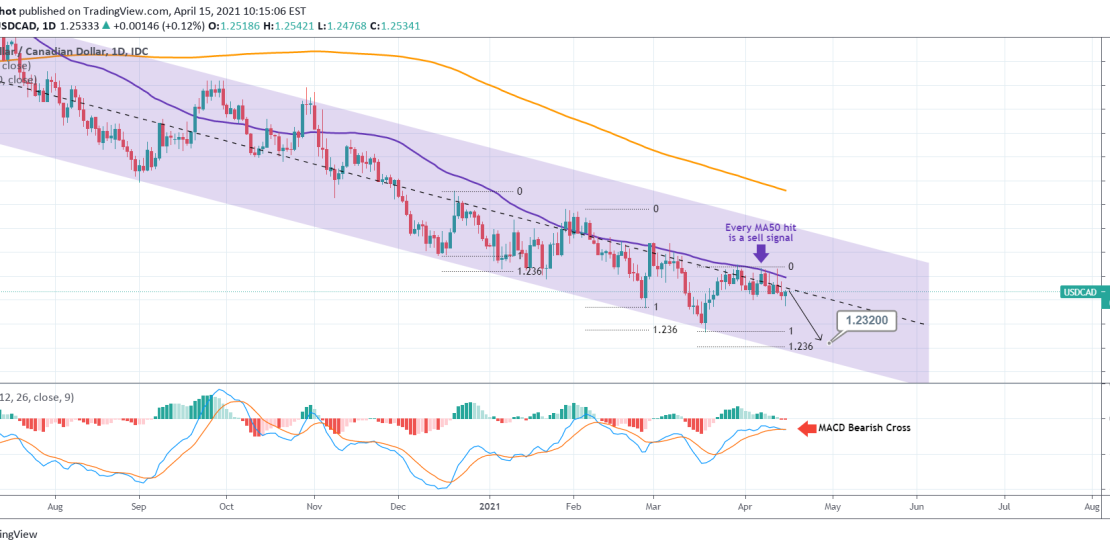
Pattern: Channel Down on 1D. Signal: Sell as the price is declining after making contact with the 1D MA50 (blue trend-line) and the MACD formed a Bearish Cross. Target: 1.2320 (the 1.236 Fib extension). ** Please support this idea with your likes and comments, it is the best way to keep it relevant and
-
GOLD broke the 1760 and 1D MA50 for the 1st time since February!
- April 15, 2021
- Posted by: Tradingshot Articles
- Category: Commodities

Finally the precious metal has broken above the 1760 Resistance which has been holding since February 26. The reason behind it wasn’t the DXY or the rise on stocks but the strong daily sell-off on the US10Y, which broke below its own 4H MA200 for the first time since November! Whether that is enough
-
DXY Emerging Death Cross on 4H.
- April 14, 2021
- Posted by: Tradingshot Articles
- Category: Forex
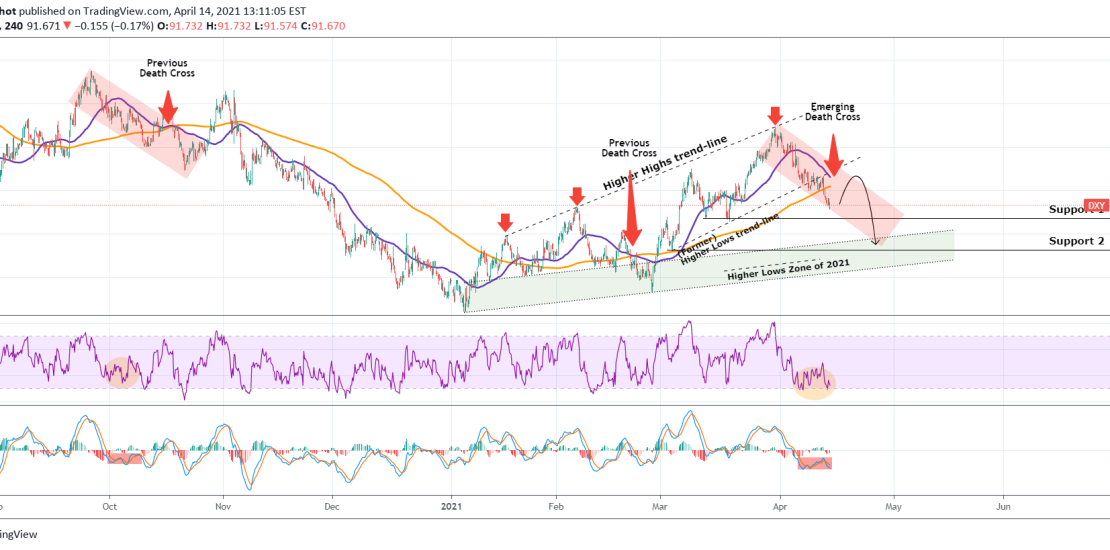
Even though the previous 4H Death Cross failed (February 19), the one that is currently emerging, resembles more that of October 19, 2020 both in term of RSI and MACD. Following the breaking of the Higher Lows trend-line as mentioned on the previous DXY idea, testing of the two Support levels seems the more
-
EURUSD Emerging Golden Cross on 4H
- April 14, 2021
- Posted by: Tradingshot Articles
- Category: Forex
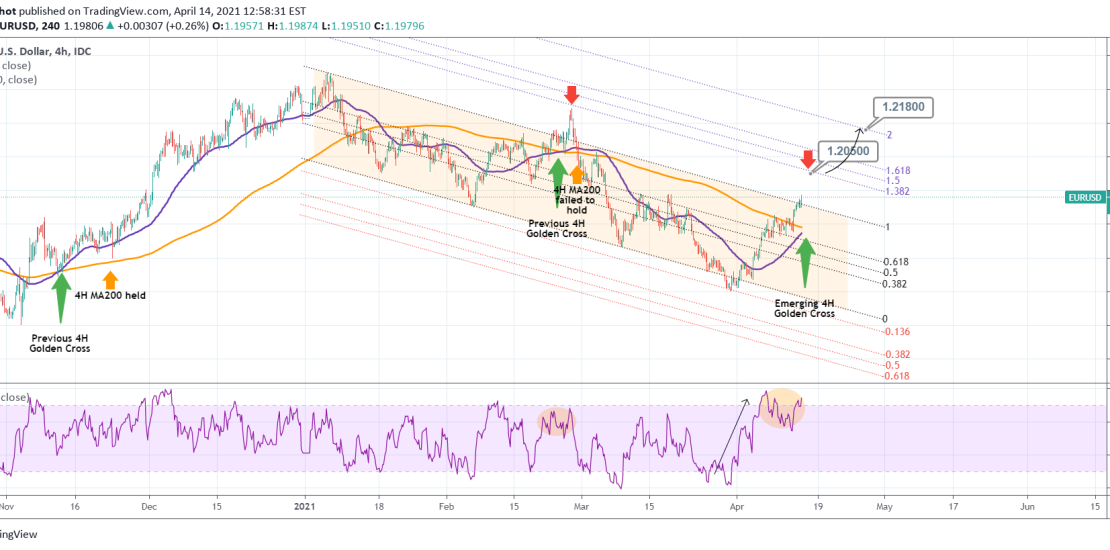
Following my most recent EURUSD idea, the price has broken above not just the 4H MA200 (orange trend-line) but also the 1.0 Fibonacci level on the Channel Down. The most important development is the emergence of the Golden Cross (4H MA50 crossing above the 4H MA200), which is typically a bullish pattern. Last time
-
URANIUM Time to go on a big buy?
- April 12, 2021
- Posted by: Tradingshot Articles
- Category: Commodities
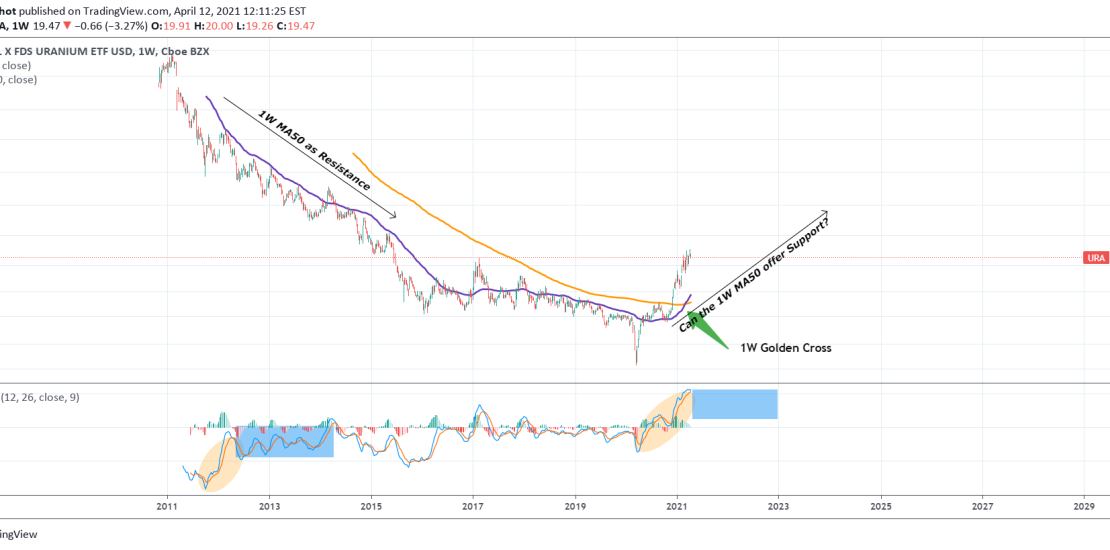
The Uranium ETF has sustained an uptrend since March 2020, with is rise resembling other bullish stock markets. Perhaps the most important development is the formation of the Golden Cross (MA50 crossing above the MA200) on the 1W time-frame. The 1W MA50 (blue trend-line) has been the Resistance throughout its multi-year downtrend. Can it