

- April 19, 2021
- Posted by: Tradingshot Articles
- Category: Cryptocurrency
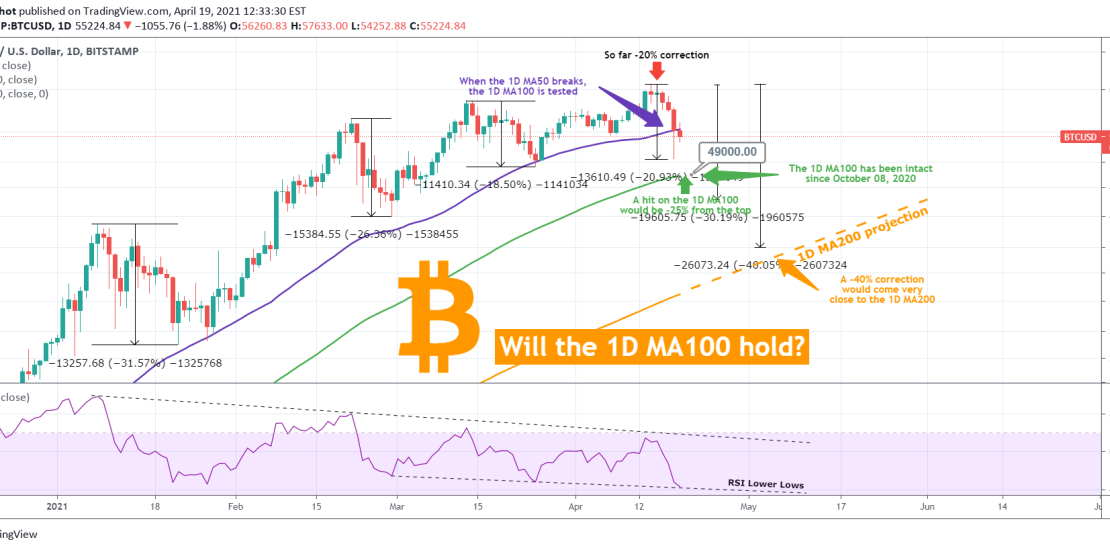
This weekend saw Bitcoin make a -20% correction from the $65000 High (All Time High/ ATH) and again as every once in a while, the panic button has been hit by many traders. The fundamentals/ news are known to you, I will only approach this technically as I have been doing during times that the market panics.
** The 1D MA50 broke, the 1D MA100 comes to support **
As with every correction in this Bull Cycle, I will consult the patterns of prior Cycles that have successfully kept us clear from losing focus and use them as an example to make projections. The chart below is from January 06, just 2 days before BTC’s $42k High and its first major correction, -31% so far the highest of this Bull Cycle.
** Correlation with the 2017 Parabolic Cycle **
As seen from that chart, during the last Parabolic Phase of Bitcoin’s previous Bull Cycle (in 2017), -20% pull-backs (like the one we have now) were quite common. In fact, if we treat the the two -18% dips as 20%, then we had a total of 5 times that the price pulled back that much during the last parabolic phase. As Parabolic Phase, I denote the period after the former All Time High (ATH) broke.
During that period, we had a -30% correction 4 times and 1 time the price dropped by -40%. It is important to note that on the 1D time-frame, the 1D MA200 (orange trend-line) was never made contact with, 2 times the 1D MA50 (blue line) initiated a rebound, while the 1D MA100 (green line) kick-started a rise 3 times (so naturally the MA50 didn’t hold 3 times).
So based on that historic price action, since the 1D MA50 broke (note that it is the first 1D candle closing below since October 07, 2020), the 1D MA100 is next in line to offer Support. This important MA period has been intact since October 08, 2020. If it holds, then that would print a -25% correction from the top at roughly $49000. A -30% correction will take the price to approximately $45.5k while a -40% to $39k. That would mean though that the 1D MA100 breaks, something that didn’t happen during the 2017 Parabolic Phase. Of course history doesn’t always repeat itself the the current Cycle doesn’t necessarily have to unfold in the same manner as the previous one, but even in the event of a -40% correction (note again that this happened only once in 2017), Bitcoin would still be above the 1D MA200 (orange trend-line), meaning that the long-term bullish trend would be intact.
So what do you think? Will the 1D MA100 hold once more as it successfully did 3 times in 2017? Or are we on a rough -40% ride towards the 1D MA200? Feel free to share your work and let me know in the comments section!
P.S. If the RSI is anything to go by, then it is currently on its Lower Lows trend-line, which is a Support.
Please like, subscribe and share your ideas and charts with the community!
——————————————————————————————————–
!! Donations via TradingView coins also help me a great deal at posting more free trading content and signals here !!
🎉 👍 Shout-out to TradingShot’s 💰 top TradingView Coin donor 💰 this week ==> kylevd23
Tradingview link: