

2020
-
DXY to pull back based on the 1D MACD.
- October 4, 2020
- Posted by: Tradingshot Articles
- Category: Forex
No Comments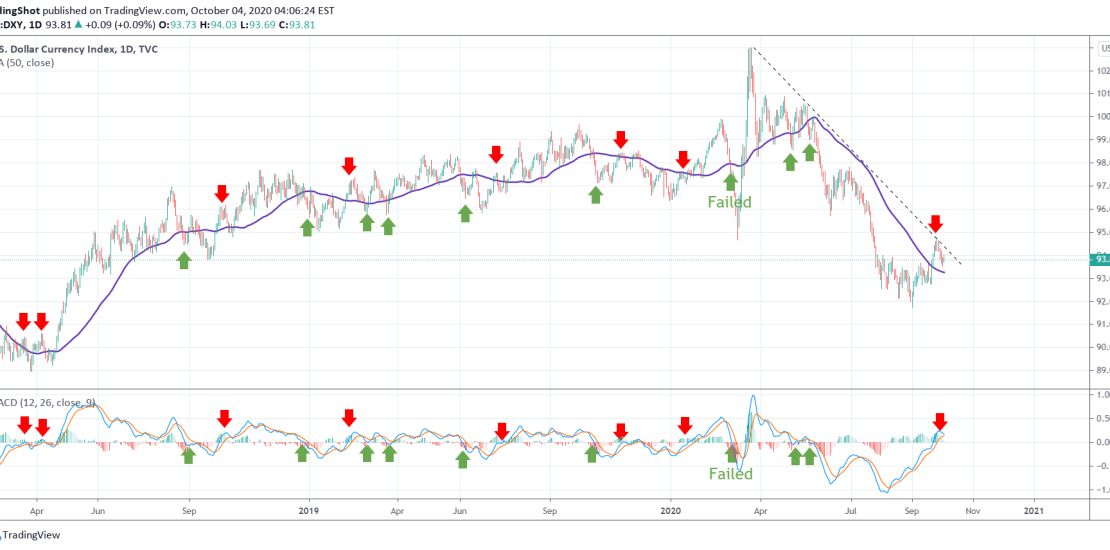
This is a simple illustration of how the MACD on the 1D chart can give a good signal, at least on the short-term. As you see on the chart, at least since March 2018, every time the MACD is trading towards 0 following a trend, the price makes a short-term directional change. I.e. when
-
DOW JONES broke above the 1D MA50. Buy Signal.
- October 4, 2020
- Posted by: Tradingshot Articles
- Category: Stock Indices
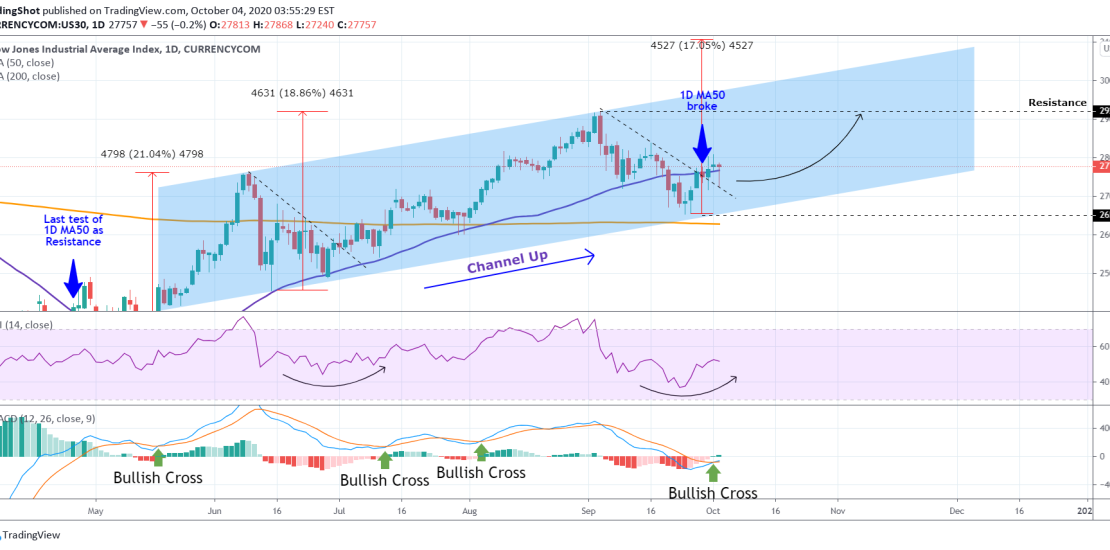
Pattern: Channel Up on 1D. Signal: Buy as the price broke above the 1D MA50, crossing it as a Resistance for the first time since April 27. Also the MACD formed a Bullish Cross. The past 3 occurrences initiated a rally. Target: 29200 (the Resistance). ** Please support this idea with your likes and
-
S&P500 Rebound on the 4H MA50
- October 3, 2020
- Posted by: Tradingshot Articles
- Category: Stock Indices
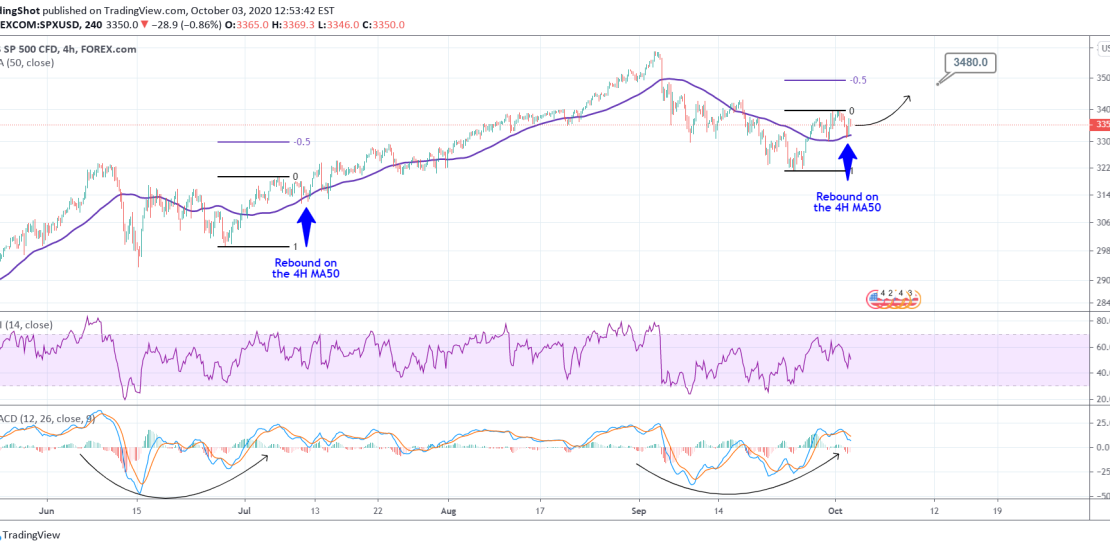
Pattern: 4H MA50 rebound. Signal: Buy as last time the 4H MA50 was tested and held as Support, a 2 month rally started. RSI and MACD are similar to that fractal of early July. Target: 3480 (the -0.5 Fib extension). Most recent S&P signal: ** Please support this idea with your likes and comments,
-
BITCOIN Recurring Triangle pattern shows a break out is close.
- October 3, 2020
- Posted by: Tradingshot Articles
- Category: Cryptocurrency
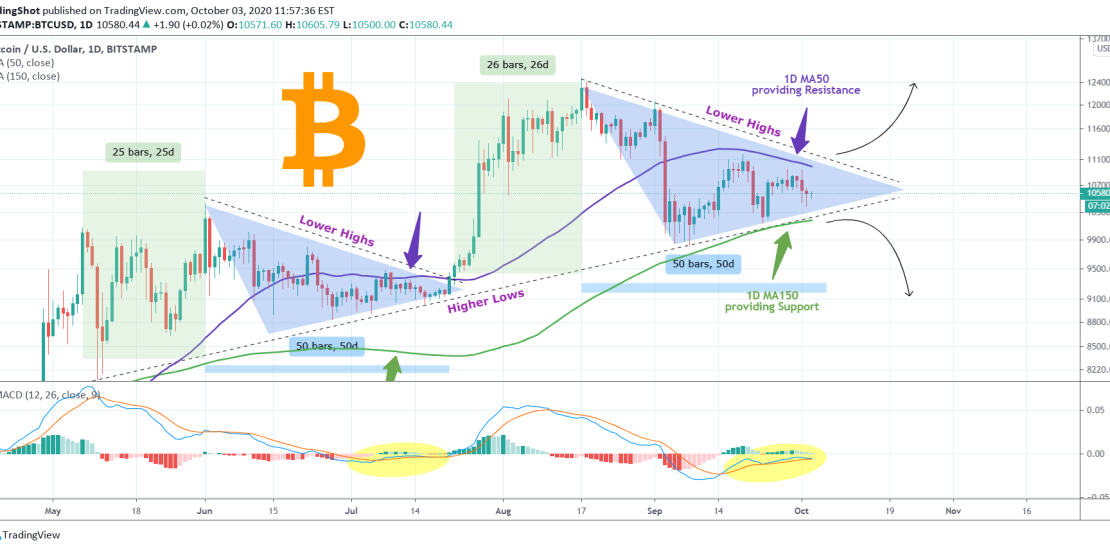
Bitcoin is trading within a Triangle on the 1D chart. Its Lower Highs trend-line is an extension of the August 17 High, but the Higher Lows trend-line goes back all the way to the May 10 Low. That was when the sustainable uptrend of Higher Highs and Higher Lows started for Bitcoin . A
-
S&P500 Buy Signal (long-term)
- September 22, 2020
- Posted by: Tradingshot Articles
- Category: Stock Indices
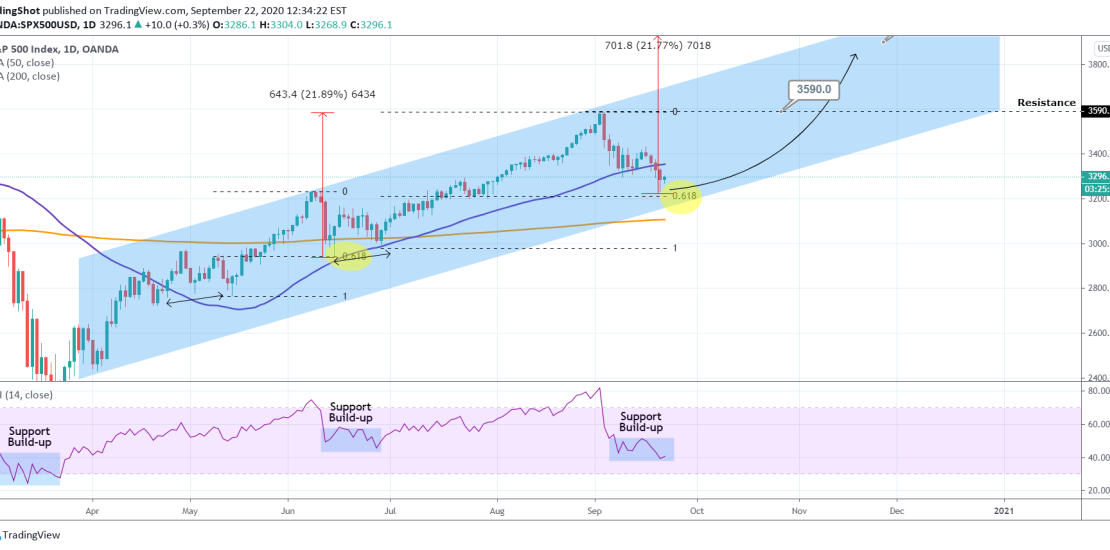
Pattern: Channel Up on 1D. Signal: Buy as the price reached the 0.618 Fibonacci retracement level from its previous bottom. Target: 3590 medium-term (Resistance) and for long-term traders 3900 (+21.90% rise from this bottom). ** Please support this idea with your likes and comments, it is the best way to keep it relevant and
-
EURUSD Trading Plan
- September 22, 2020
- Posted by: Tradingshot Articles
- Category: Forex
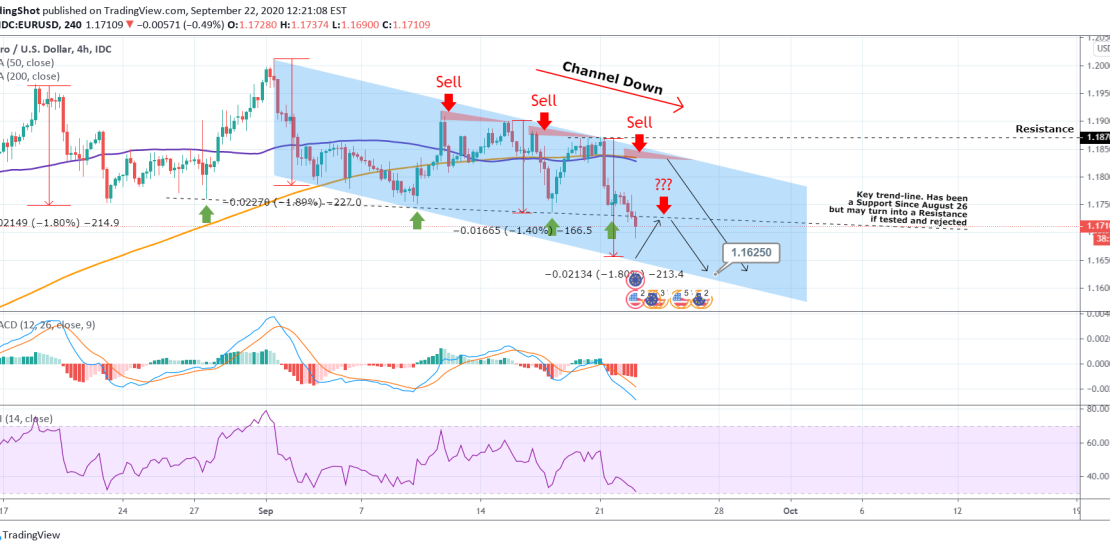
Pattern: Channel Down on 4H. Signal: Sell either on the key trend-line (dashed) or on the Lower High trend-line of the Channel Down. Target: 1.16250 (Lower Low). ** Please support this idea with your likes and comments, it is the best way to keep it relevant and support me. ** !! Donations via TradingView
-
DXY Trading Plan
- September 22, 2020
- Posted by: Tradingshot Articles
- Category: Forex
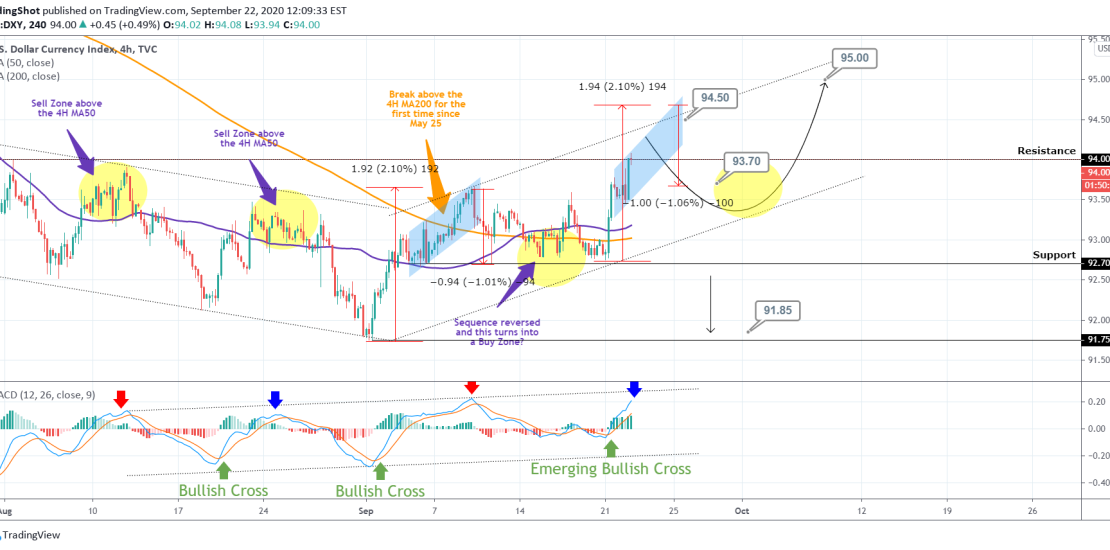
Pattern: Channel Up on 4H. Signal: (A) Sell as it approaches the Higher High trend-line of the pattern, (B) Buy when it approaches the Higher Low trend-line. Target: (A) 93.70 (potential -1.10% drop from the symmetrical Higher High), (B) 95.00 (just below the Higher High trend-line). Most recent DXY signal: ** Please support this
-
BITCOIN Last level of Support before a bigger correction comes.
- September 21, 2020
- Posted by: Tradingshot Articles
- Category: Cryptocurrency
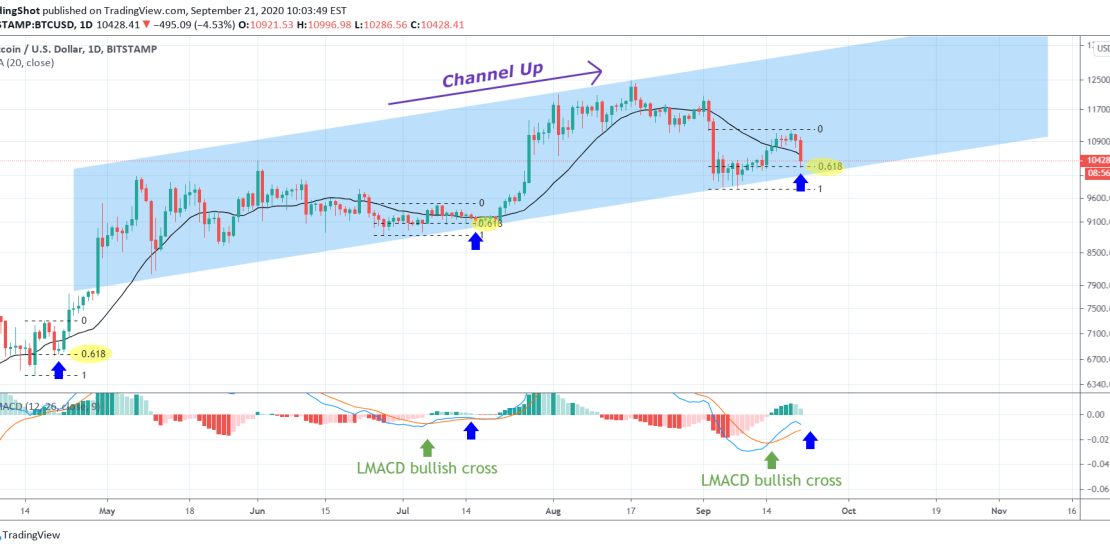
BTC has opened Monday lower as a result of the continuous selling pressure on the stock markets. This is the natural psychological against the threat of rising COVID cases and the inability of the economy to withstand a potential new lockdown. The price is therefore currently about to test again the Higher Low trend-line
-
BITCOIN The 1W MA50 is testing its ATH! Bullish Signal!
- September 17, 2020
- Posted by: Tradingshot Articles
- Category: Cryptocurrency
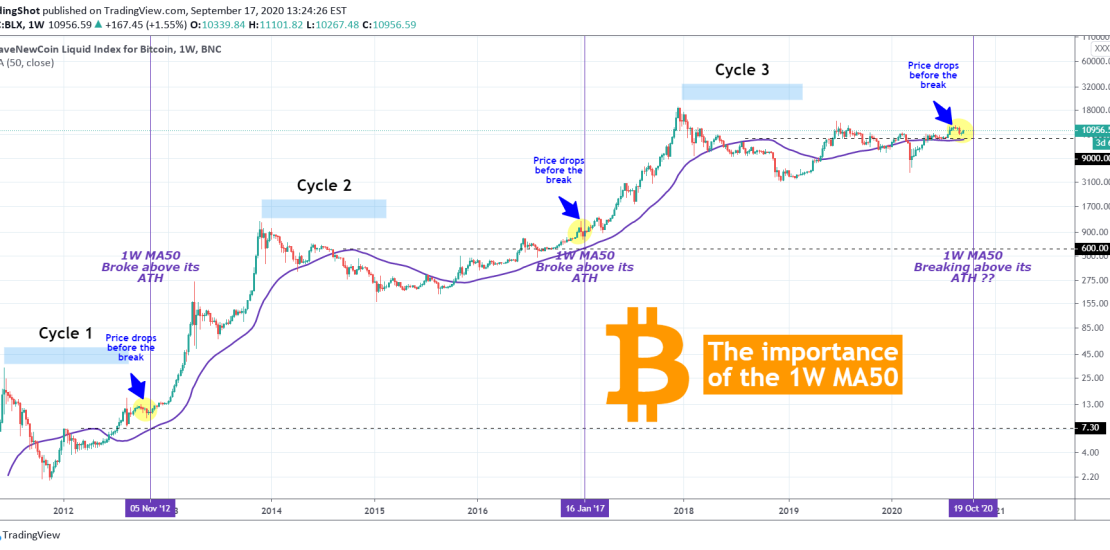
Yesterday I looked into the importance of the 1D MA50 and how a potential test can affect Bitcoin: That made me go a timeframe higher into 1W and search for clues on its own MA50. I found a very important cyclical pattern and I want to share it with you. As you see during
-
NATURAL GAS Trading Plan
- September 17, 2020
- Posted by: Tradingshot Articles
- Category: Commodities
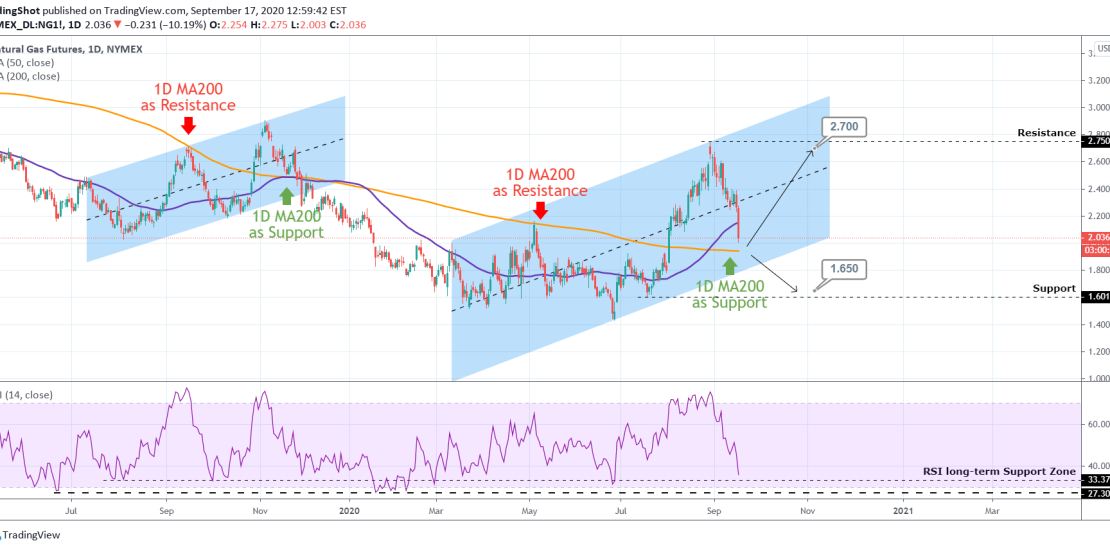
Pattern: Channel Up on 1D. Signal: (A) Buy as long as he price trades above the 1D MA200 (orange line) (B) Sell if it breaks below it. Target: (A) 2.700 (right below the Resistance) (B) 1.650 (right above the Support). *Note: the RSI is near its 1 year Support Zone. Only once this failed