

- October 3, 2020
- Posted by: Tradingshot Articles
- Category: Cryptocurrency
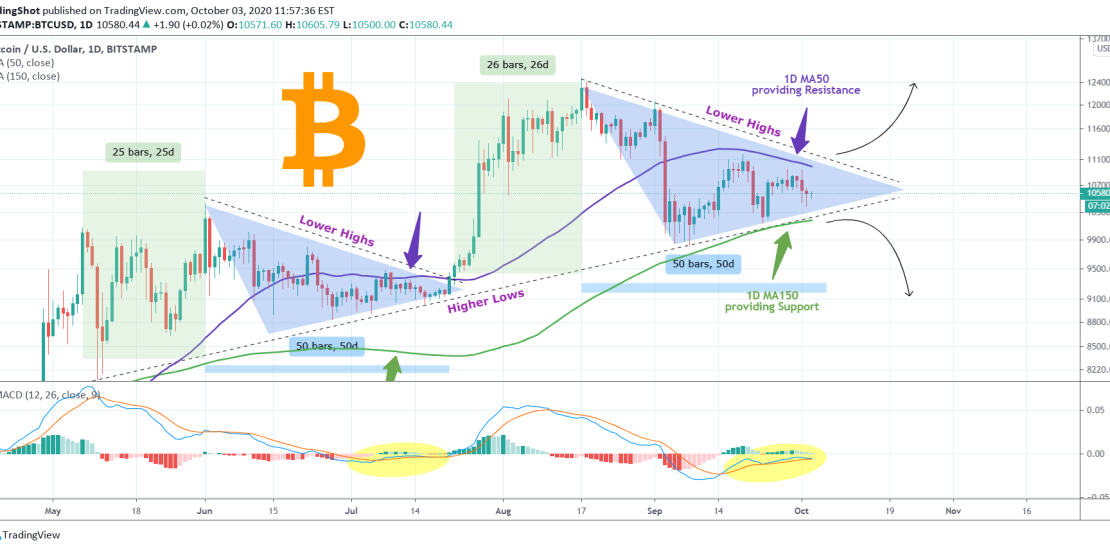
A similar Triangle, can be seen during June 01 – July 21. That Triangle before it broke upwards starting the rally to the August 17 High, it was squeezed within the 1D MA50 (blue trend-line and the Higher Lows trend-line, with the 1D MA150 (green trend-line below). From its top to the day of the break-out, the Triangle lasted 50 days. Also the time distance between the first High of the bullish channel to the next one (green shape) was 25 days.
The current Triangle pattern is right now also squeezed with the 1D MA50 acting as the Resistance and the MA150 as the Support. It is on 46 days since the August 17 High. The distance between that High and the break-out from the previous Triangle was 26 days. So we can claim that the two sequences are fairly symmetrical, something shown also on the LMACD which gets squeezed every time the Triangle is approaching its completion? Where that completion ends with an upward or downward break-out, that remains to be seen, but this short-term data series favor a bullish break.
Which direction do you think the Triangle will break-out to? Feel free to share your work and let me know in the comments section!
Please like, subscribe and share your ideas and charts with the community!
——————————————————————————————————–
!! Donations via TradingView coins also help me a great deal at posting more free trading content and signals here !!
🎉 👍 Shout-out to TradingShot’s 💰 top TradingView Coin donor 💰 this week ==> gergiabboud
——————————————————————————————————–