

- October 4, 2020
- Posted by: Tradingshot Articles
- Category: Forex
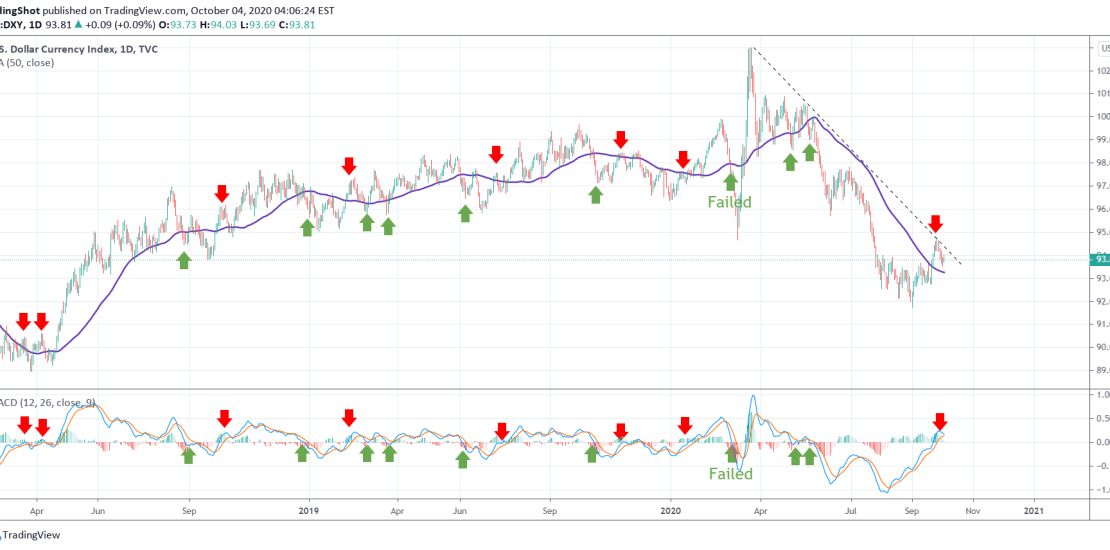
This is a simple illustration of how the MACD on the 1D chart can give a good signal, at least on the short-term.
As you see on the chart, at least since March 2018, every time the MACD is trading towards 0 following a trend, the price makes a short-term directional change. I.e. when the price is rising and the and the MACD hits 0.00, then the price temporarily pulls back lower. Similarly when the price is falling and the MACD hits 0.00, then the price temporarily pulls back higher.
This is a very reliable indicator as it has only failed to deliver once on March 2020 (when COVID naturally invalidated all technicals).
Are you selling, at least on the short-term, based on this?
P.S. For those who recognize the analysis, this is a repost of the idea below which I published on September 24 and got deleted:
** Please support this idea with your likes and comments, it is the best way to keep it relevant and support me. **
——————————————————————————————————–
!! Donations via TradingView coins also help me a great deal at posting more free trading content and signals here !!
🎉 👍 Shout-out to TradingShot’s 💰 top TradingView Coin donor 💰 this week ==> billstenzel
——————————————————————————————————–
Tradingview link:
https://www.tradingview.com/chart/DXY/UazWiVJu-DXY-to-pull-back-based-on-the-1D-MACD